Create a Derived Metric
Overview
Use Cases
Derived metrics are created from basic metrics. They are mainly used to add business filters, statistical periods, and derived calculations. Common examples include:
| Metric Name | Metric Definition | Description |
|---|---|---|
| Valid Order Amount | * Basic metric: Order Amount * Business filter: Order Status = "Valid" | Based on the Order Amount metric, calculates only orders whose status is "Valid". |
| Average Daily Visits in the Last 7 Days | * Basic metric: Visiting Users * Time constraint: average by day over the last 7 days | Queries daily visiting users for the current day and the previous 6 days, then calculates the average across those 7 days. |
| Sales Growth Rate | * Basic metric: Sales Amount * Derivation method: daily period-over-period growth rate | Based on Sales Amount, calculates the current day and previous day values, then calculates growth rate as (current value - previous value) / previous value. |
Feature Introduction
A derived metric is created from a basic metric or composite metric by combining time constraints, business filters, derivation methods, and analysis dimensions.
Create a Derived Metric
Steps
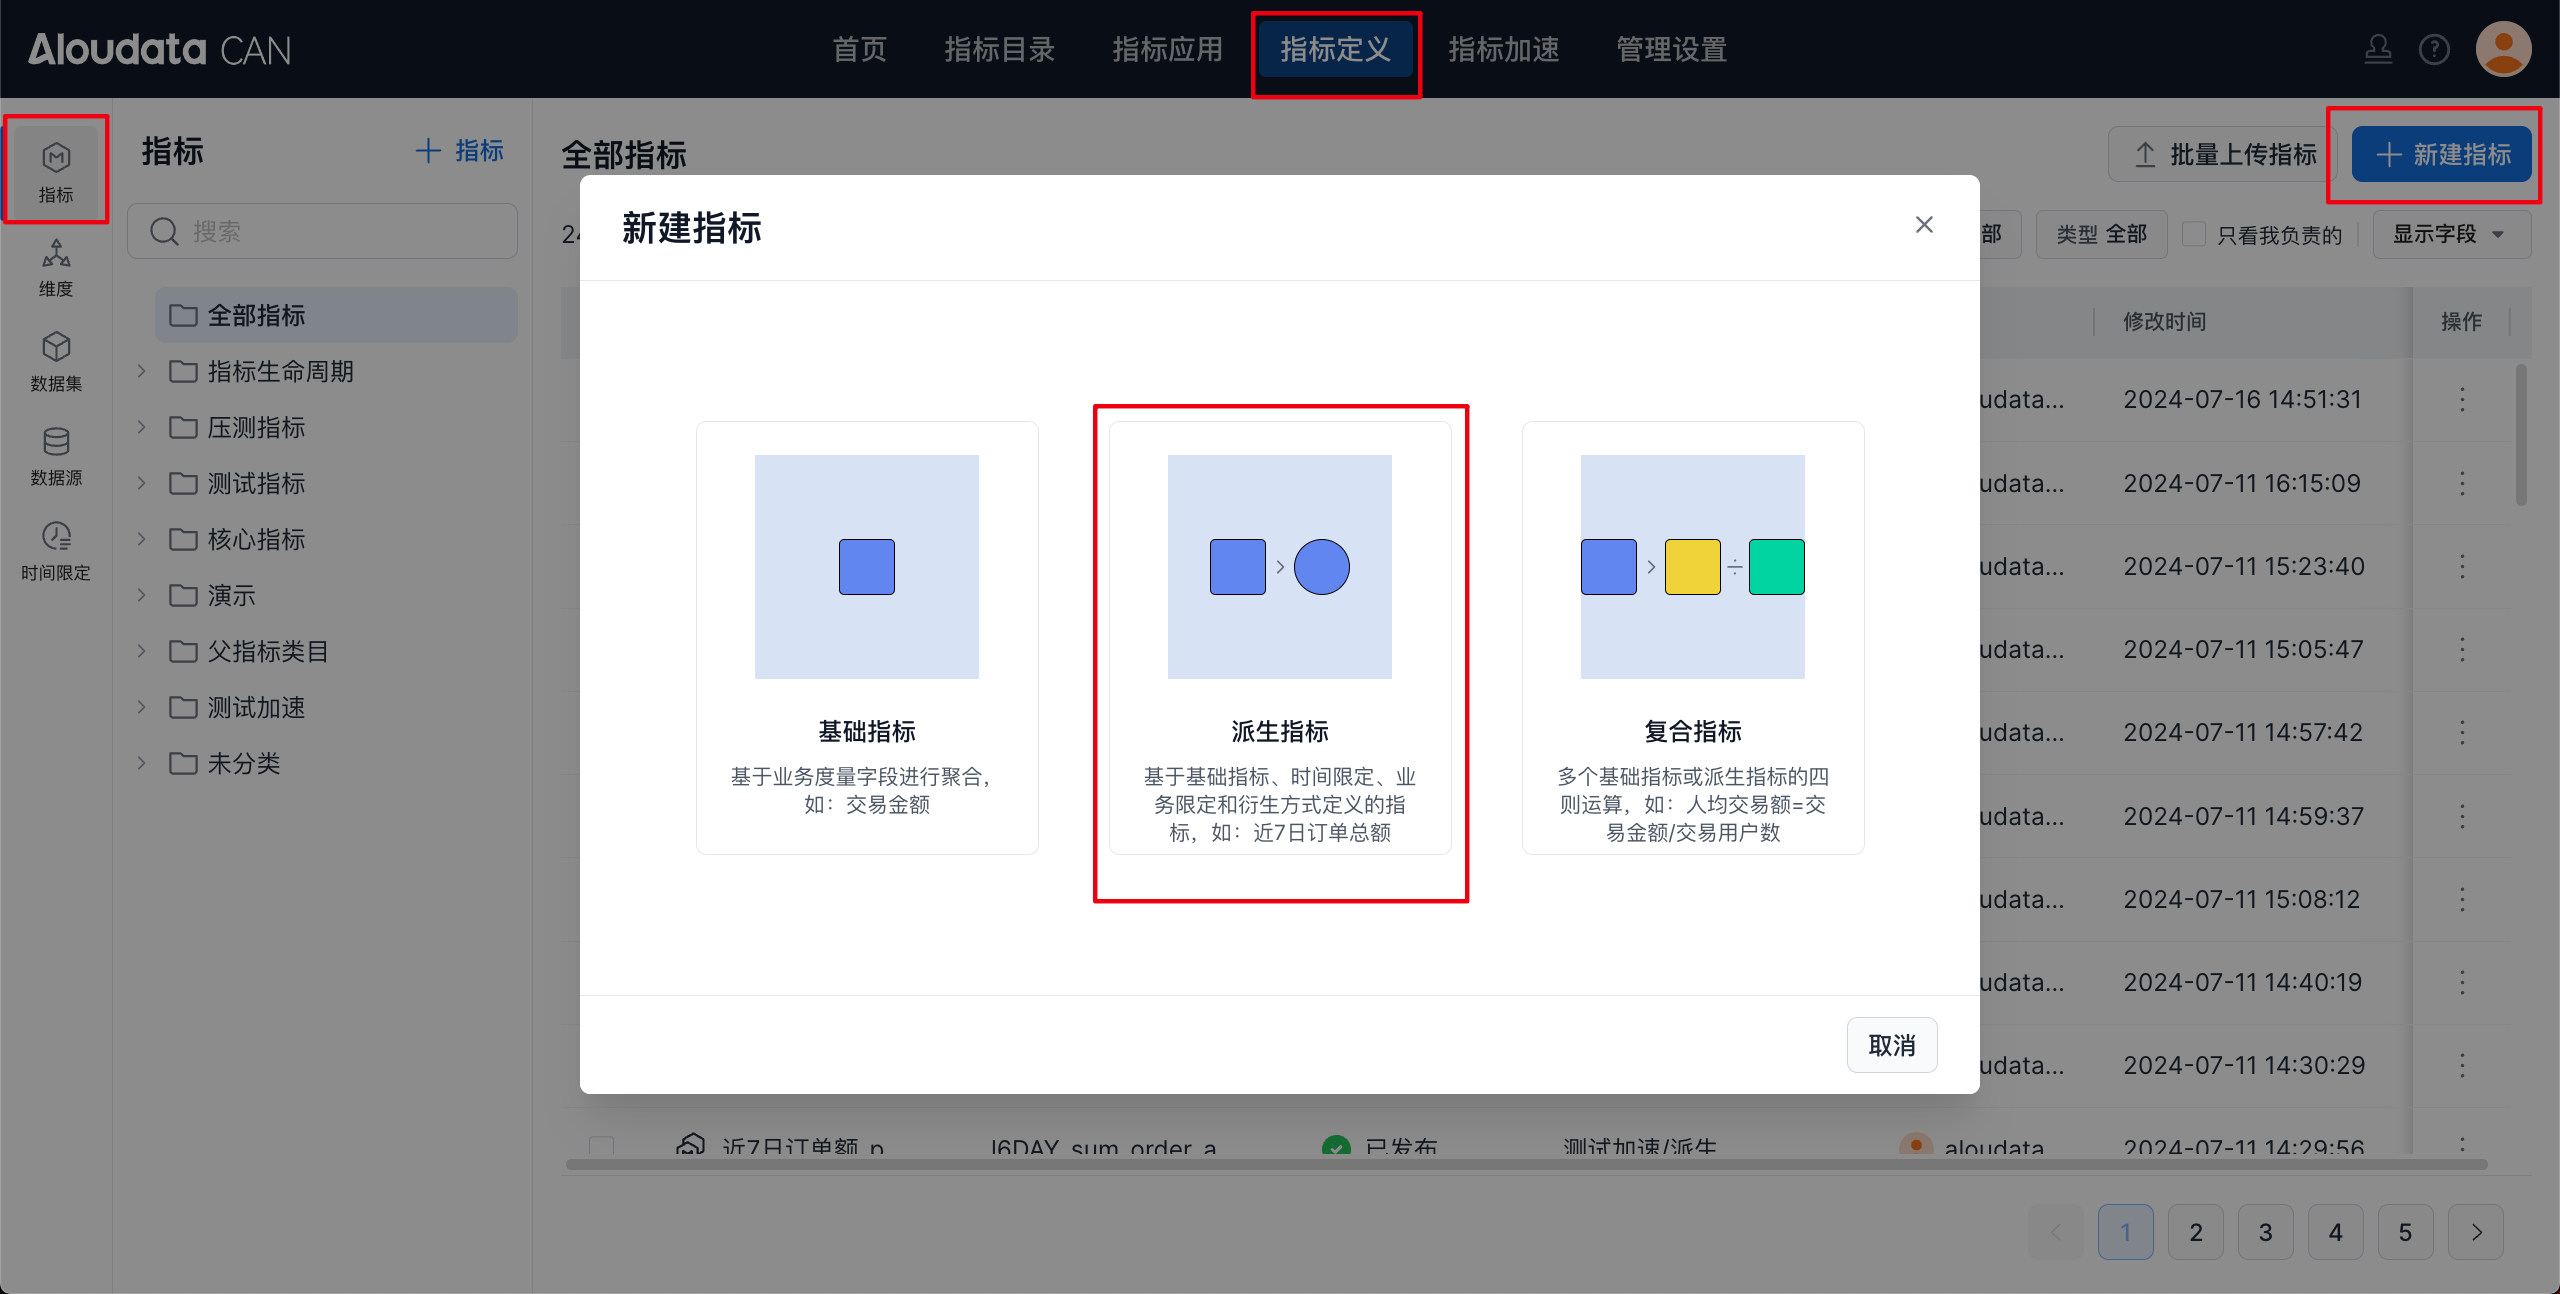
Entry Point
In the left navigation bar, select Metric Definition. In the upper-right corner of the page, click New Metric, then select Derived Metric in the dialog.
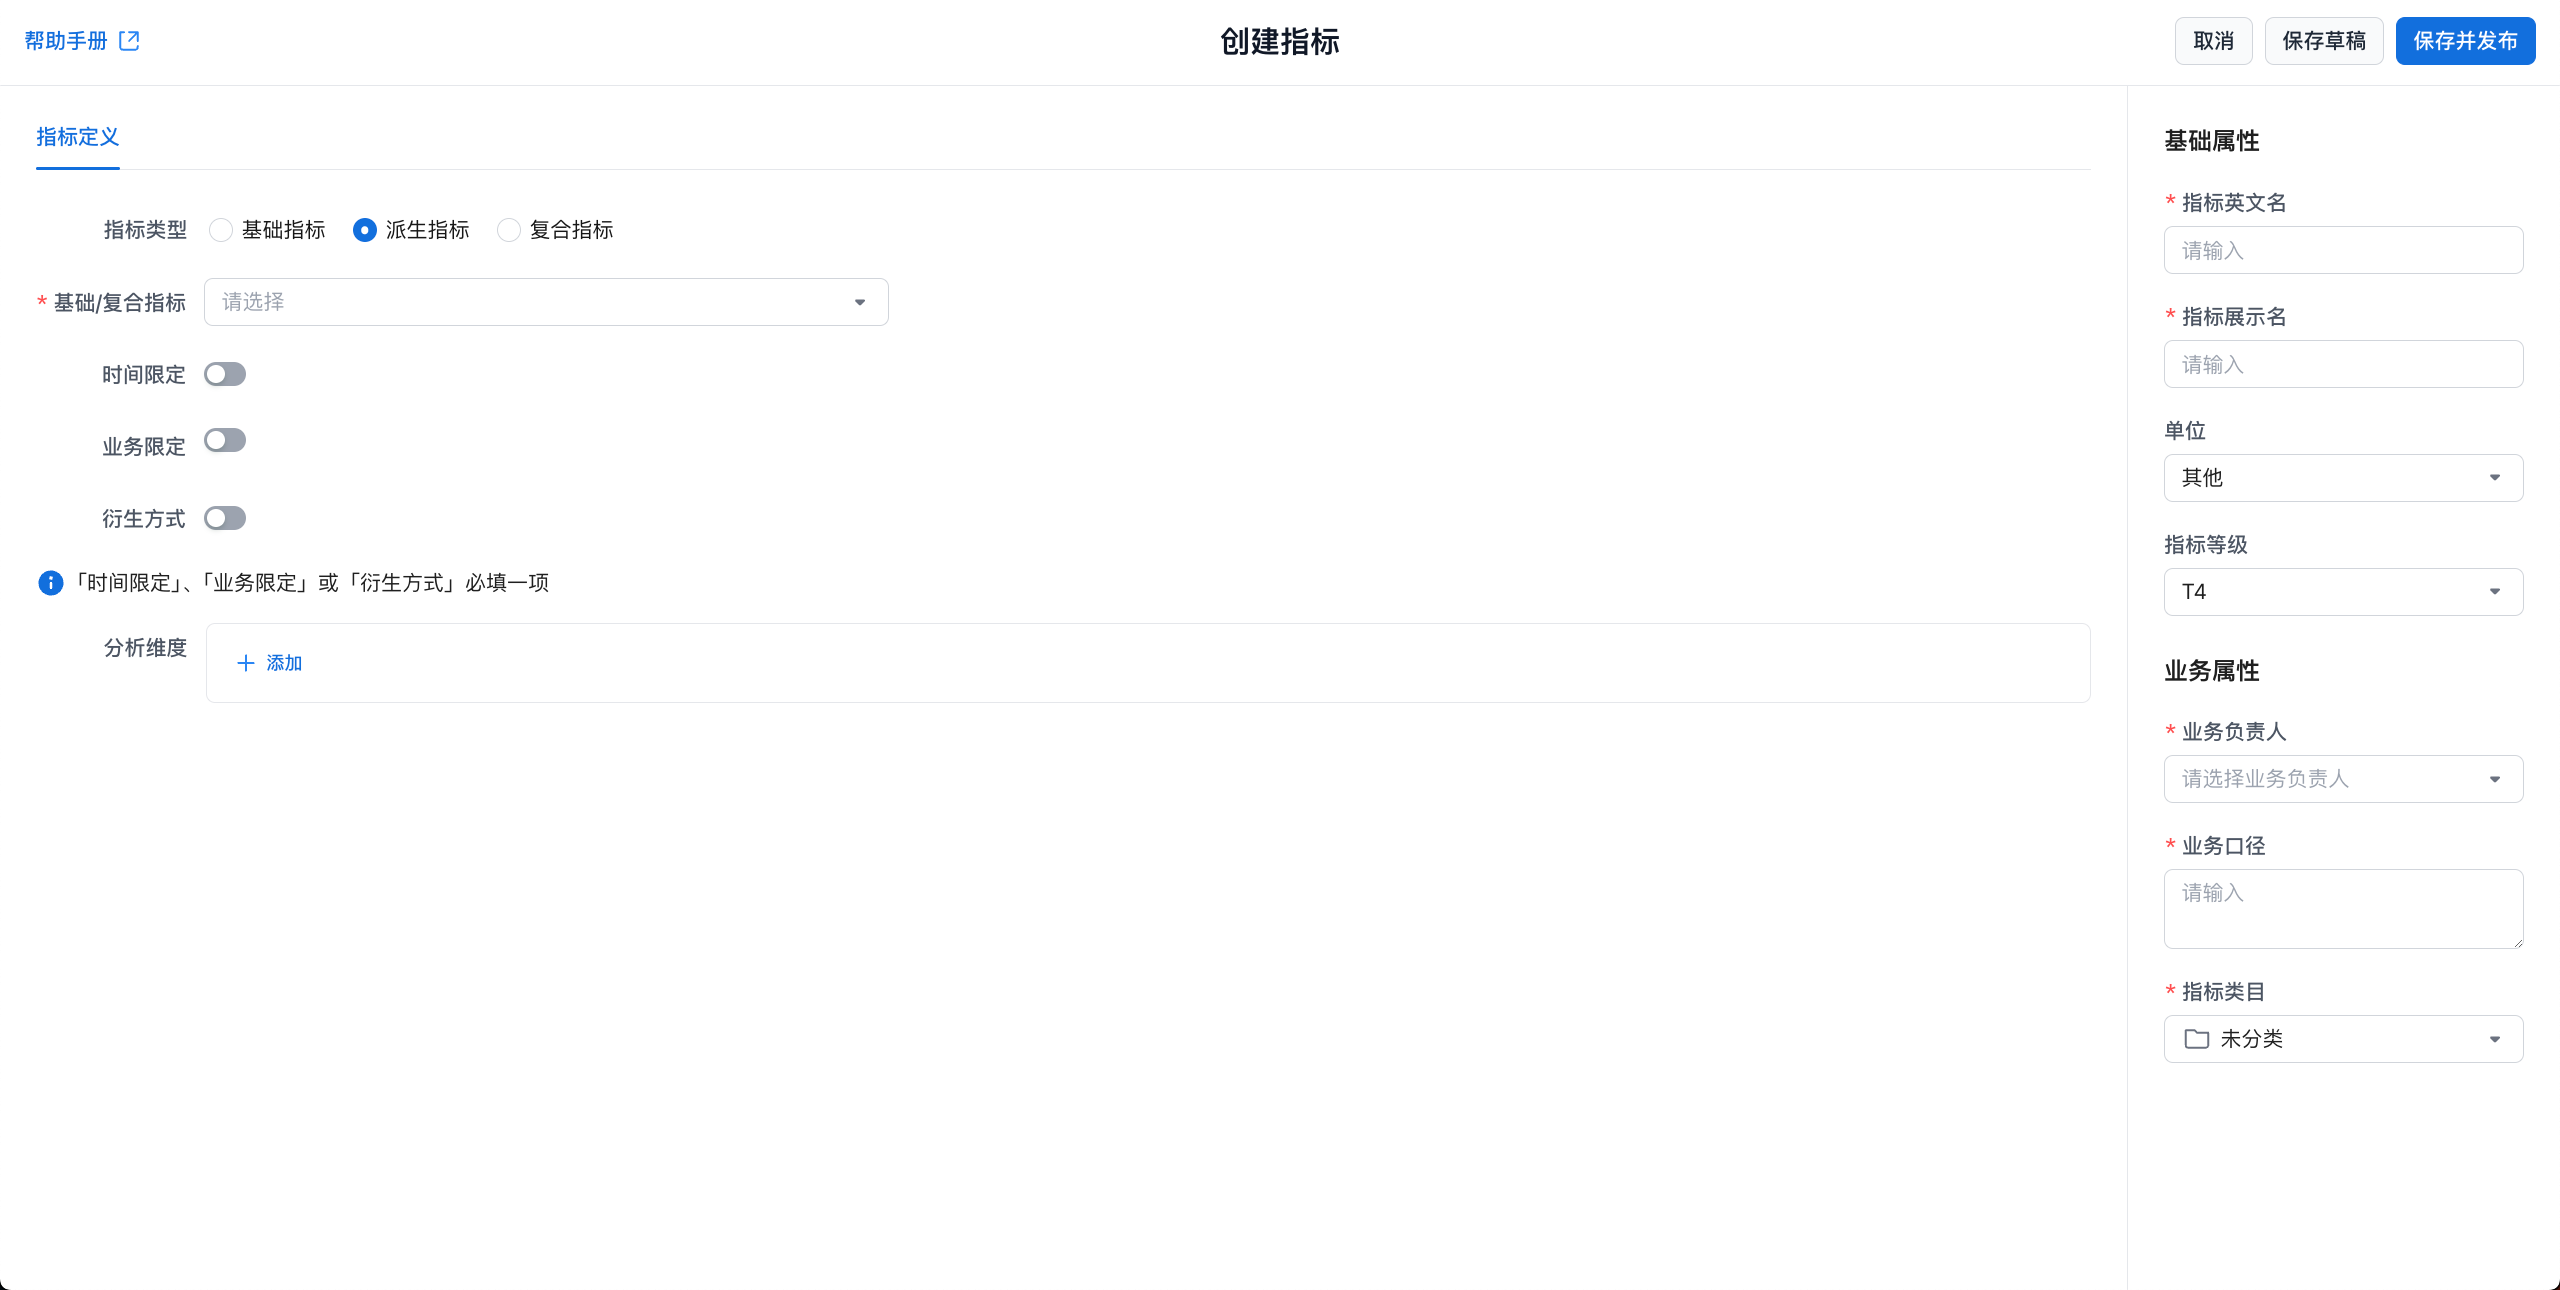
Configure Metric Definition
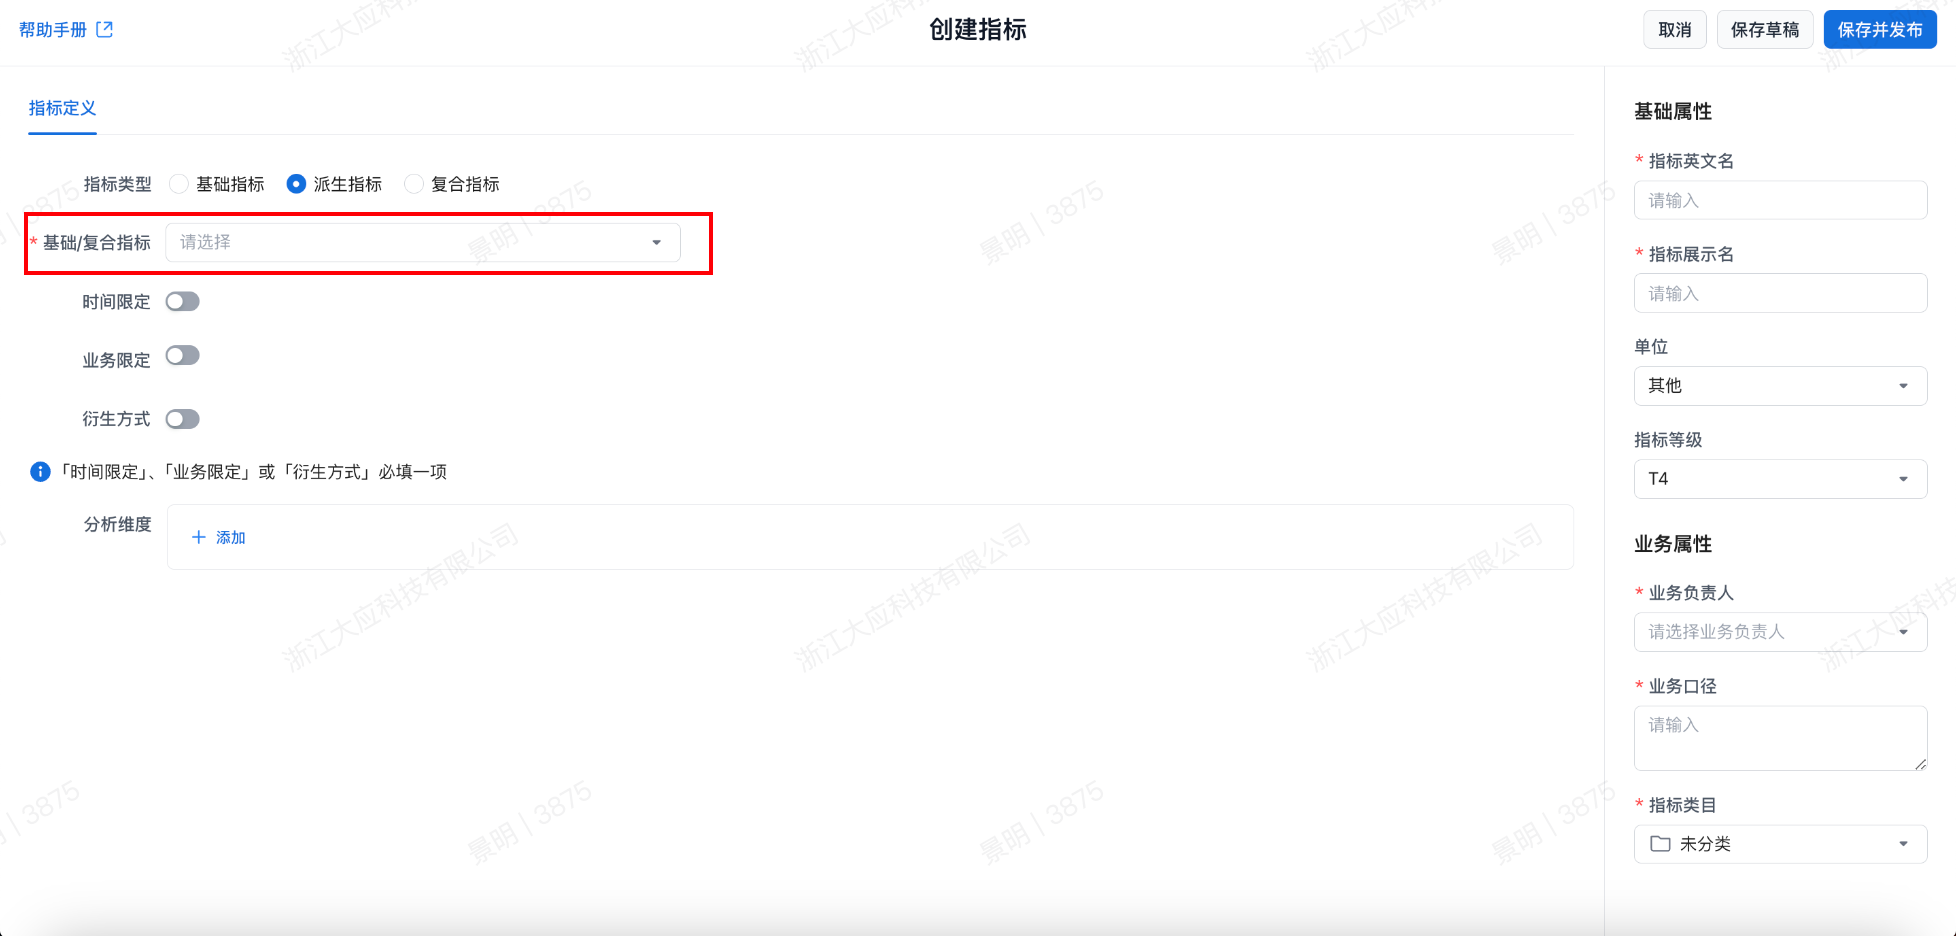
Set Basic or Composite Metric
In the drop-down list, select the Basic Metric or Composite Metric used to create the derived metric.
A derived metric must be defined from an atomic metric or from a composite metric that does not contain any derived metrics.
Set Time Constraint
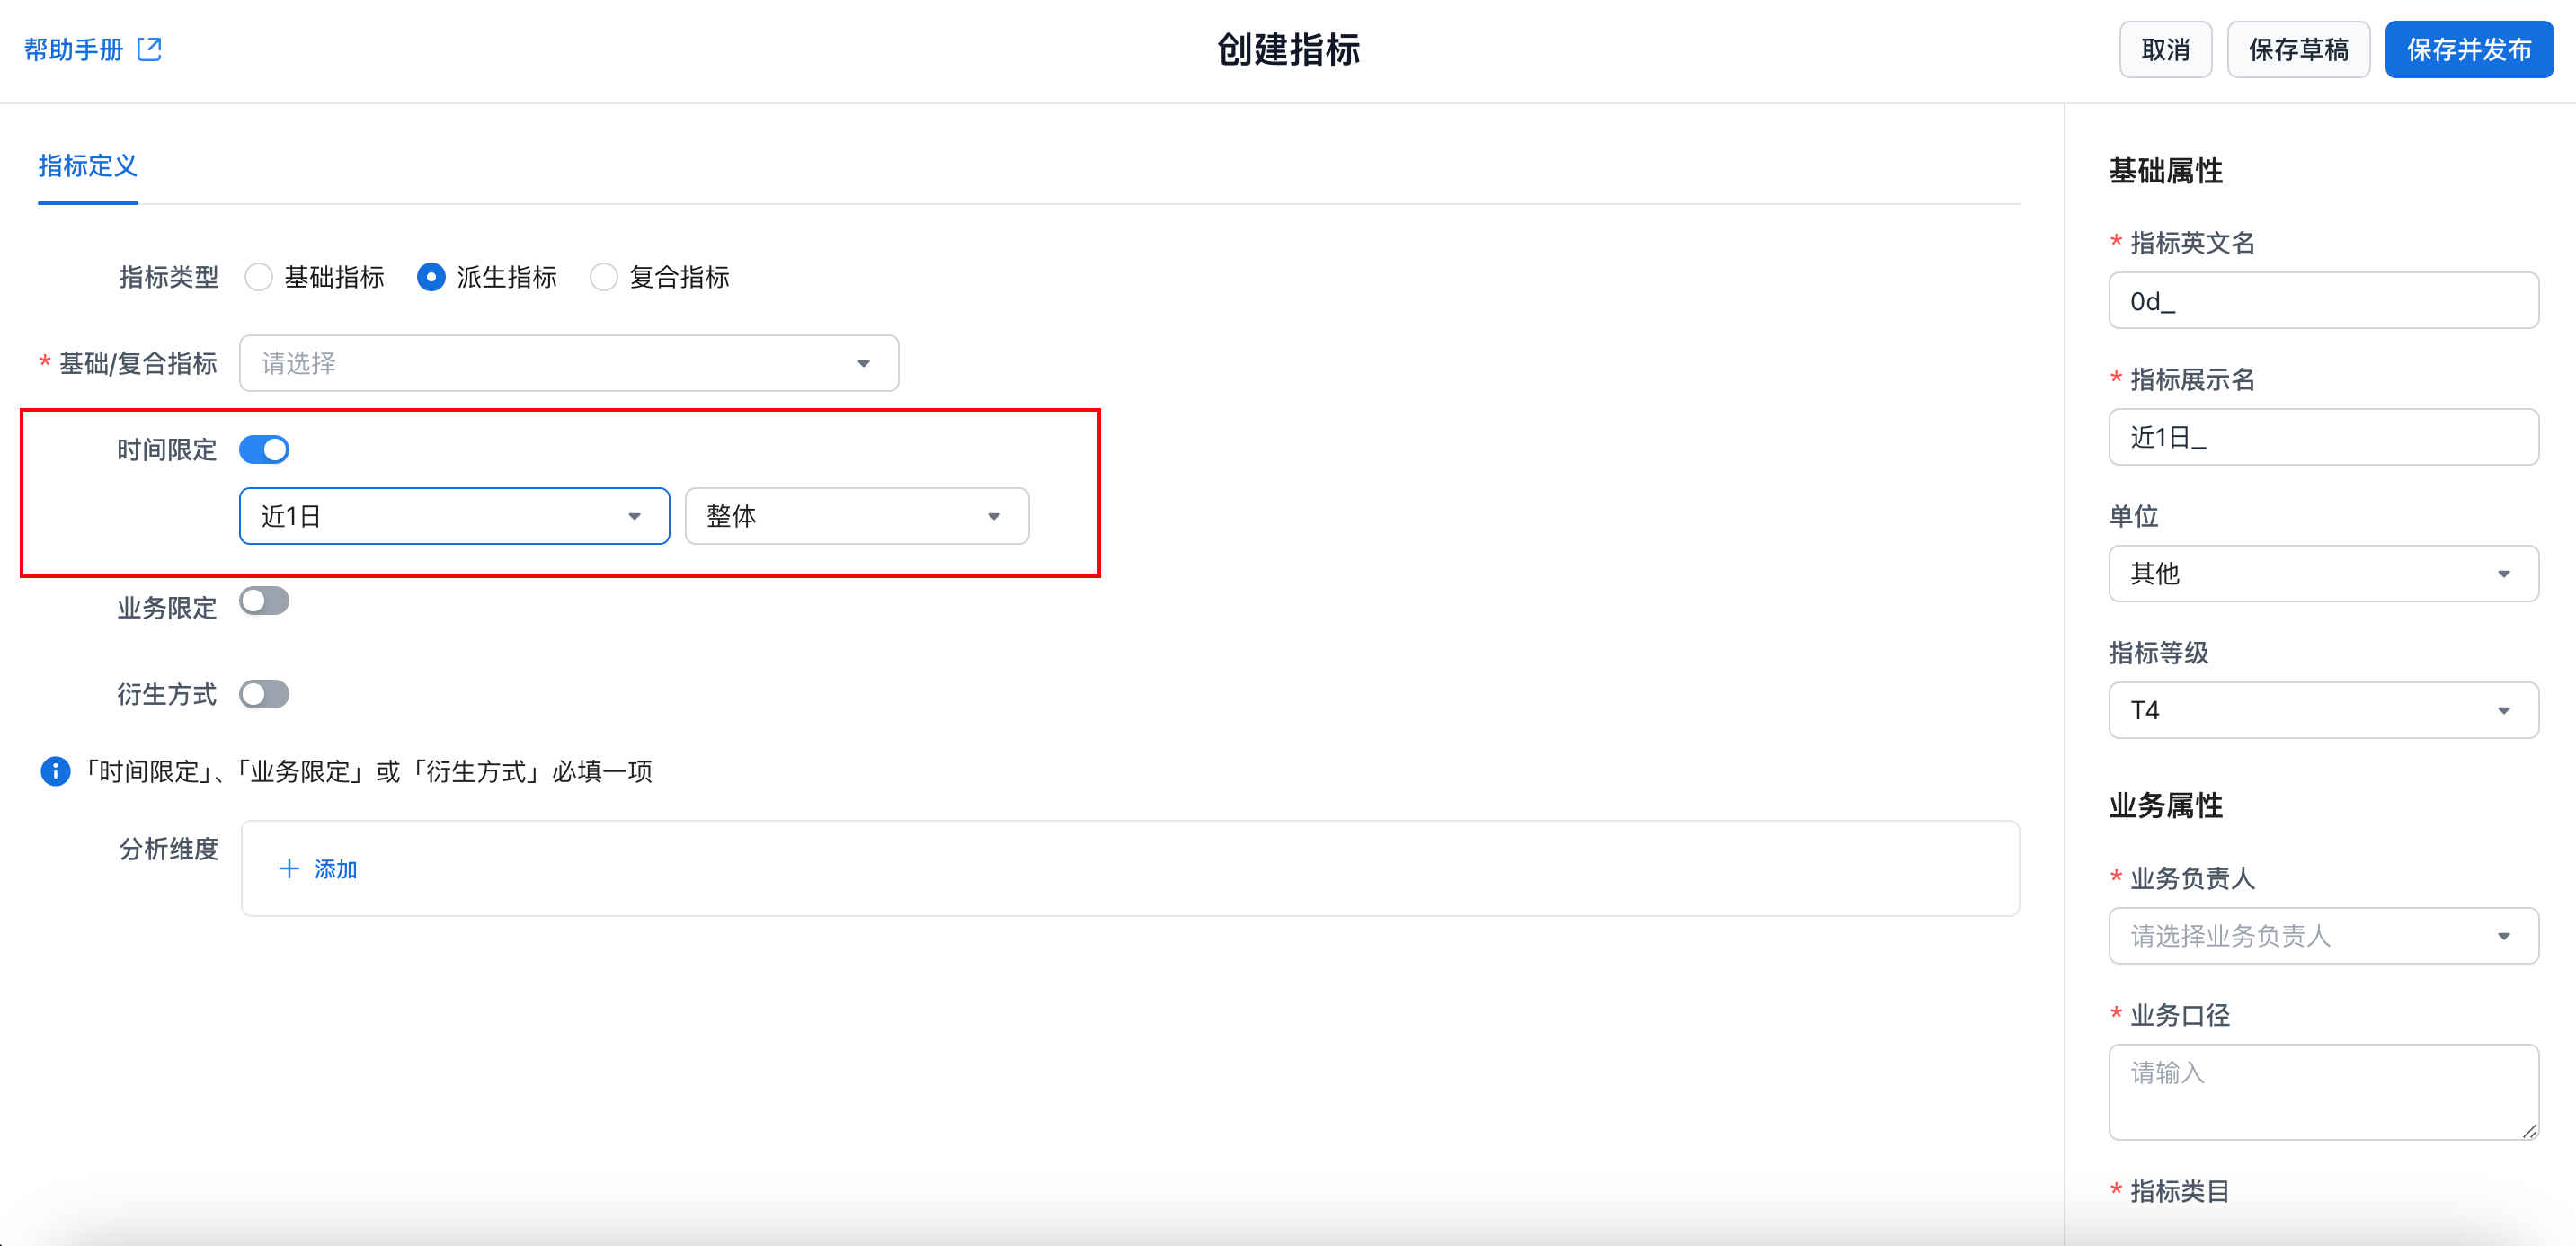
Detailed configuration for custom time constraints:
- Quick filters
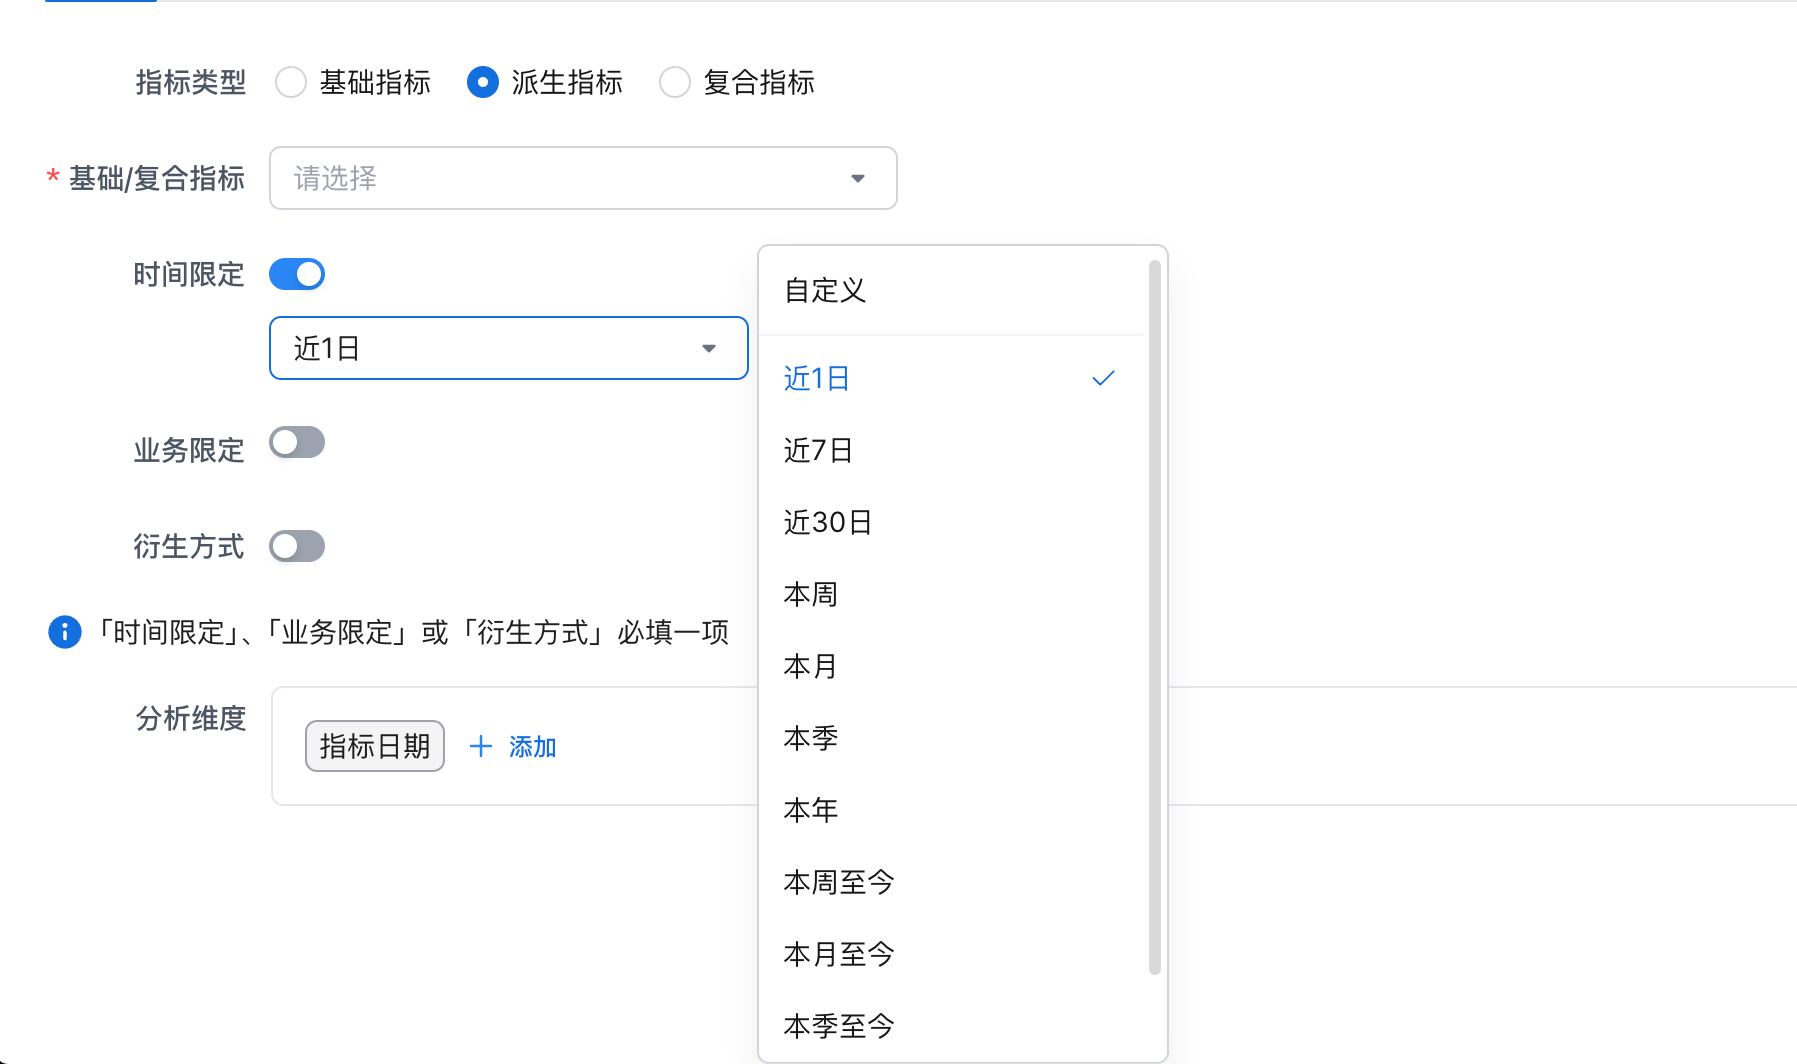 |
The system includes commonly used statistical periods. Administrators can manage these common statistical periods in Metric Definition -> Time Constraints. |
|---|---|
- Custom statistical periods
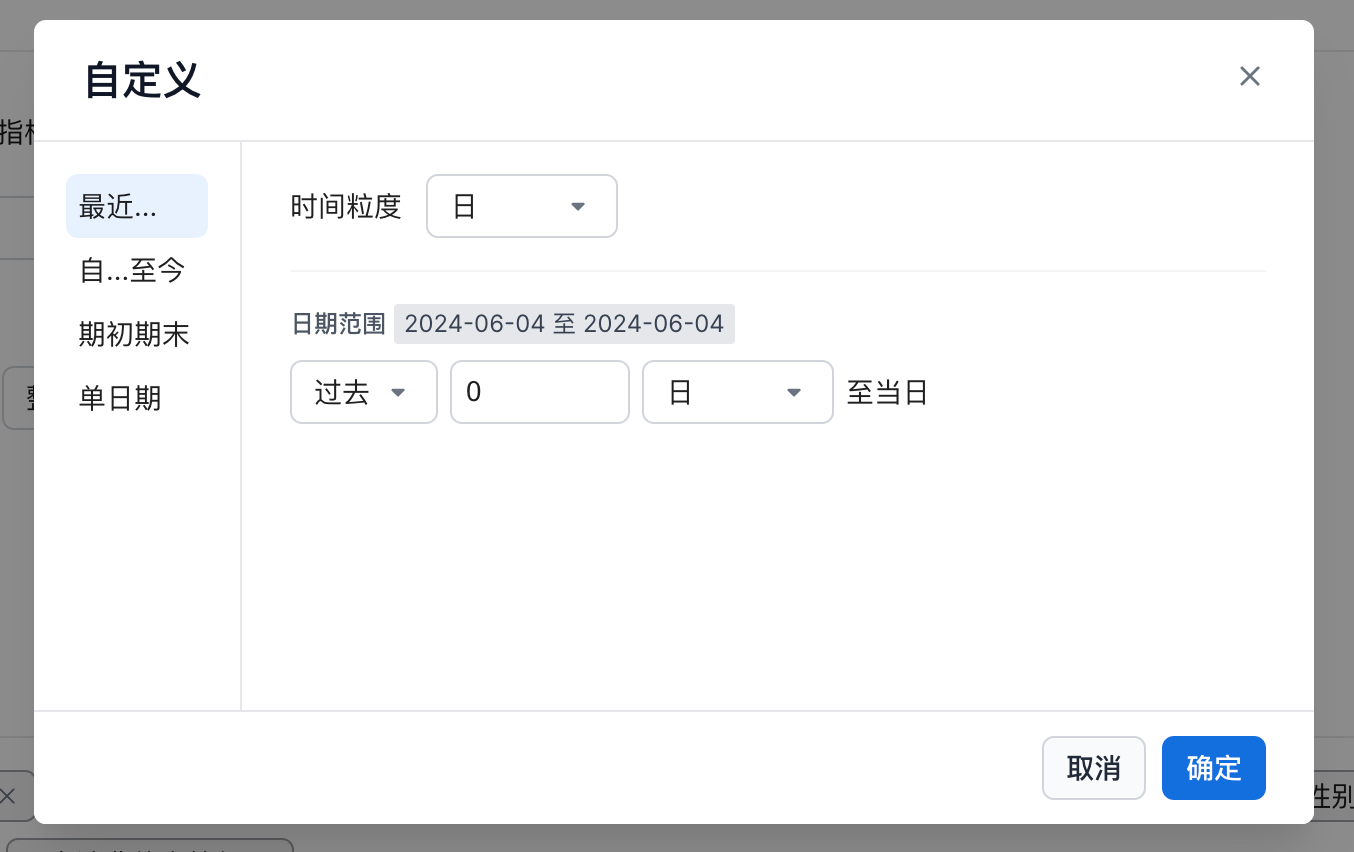 |
Use the Recent... mode to define a statistical date range. This is suitable for selecting a range based on the current date, with an offset forward or backward. Common configurations include:- Day granularity - past 3 days through today- If the reference date is 2024-05-20, the statistical range is 2024-05-17~2024-05-20, for 4 days in total.- Day granularity - past 1 month through today- If the reference date is 2024-05-20, the statistical range is 2024-04-20~2024-05-20.- Month granularity - next 1 year through current month- If the reference date is 2024-05-20, the statistical range is 2024-05~2025-05, covering whole-month data.- Day granularity - past 5 days (trading days) through today- If the reference date is 2024-05-20, the system uses 2024-05-20 as the reference and looks back 5 trading days. |
|---|---|
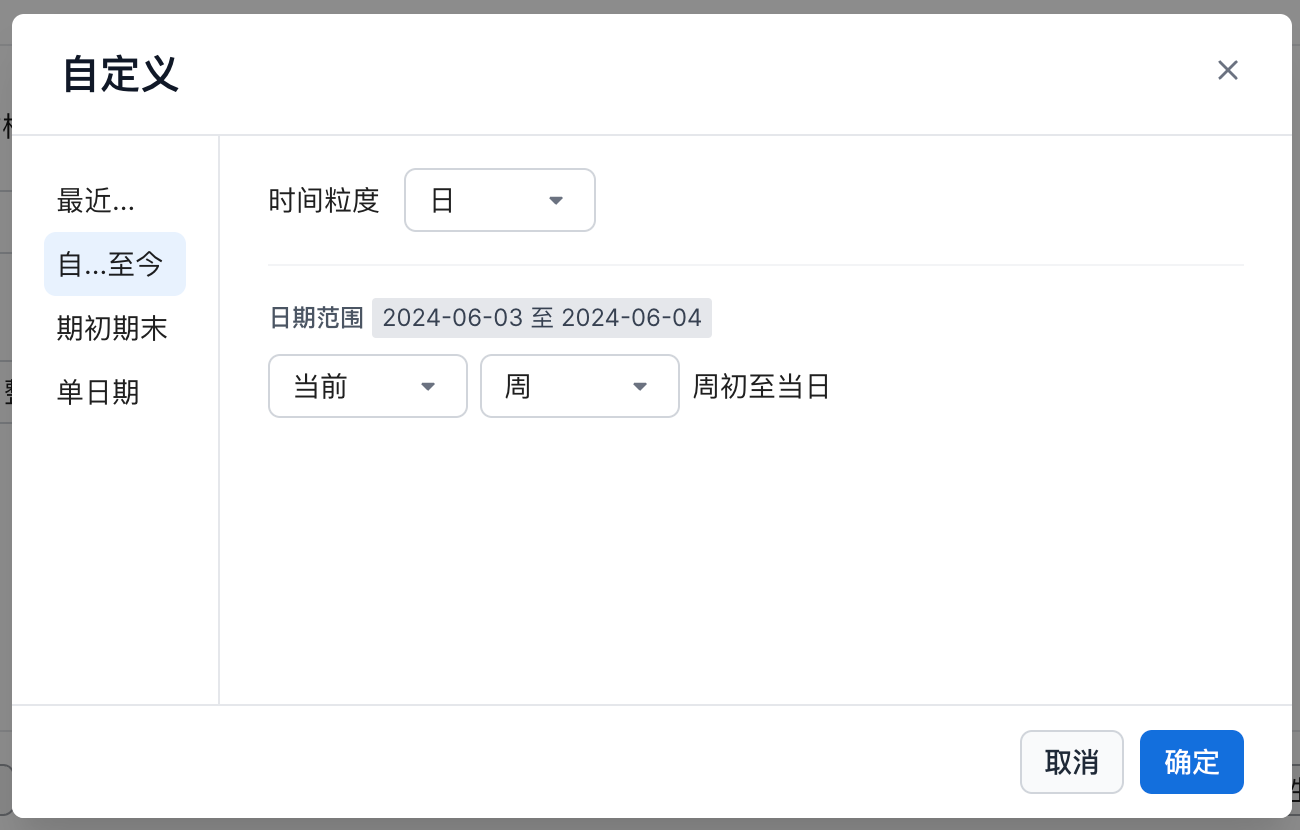 |
Use the From...to Date mode to define a statistical date range. This is suitable for cumulative multi-day metrics such as year to date or month to date.- Day granularity - from the first day of the current month through today- If the reference date is 2024-05-20, the statistical range is 2024-05-01 ~ 2024-05-20.- Month granularity - from the first month of the year one year ago through the current month- If the reference date is 2024-05-20, the statistical range is 2023-01 ~ 2024-05. |
|---|---|
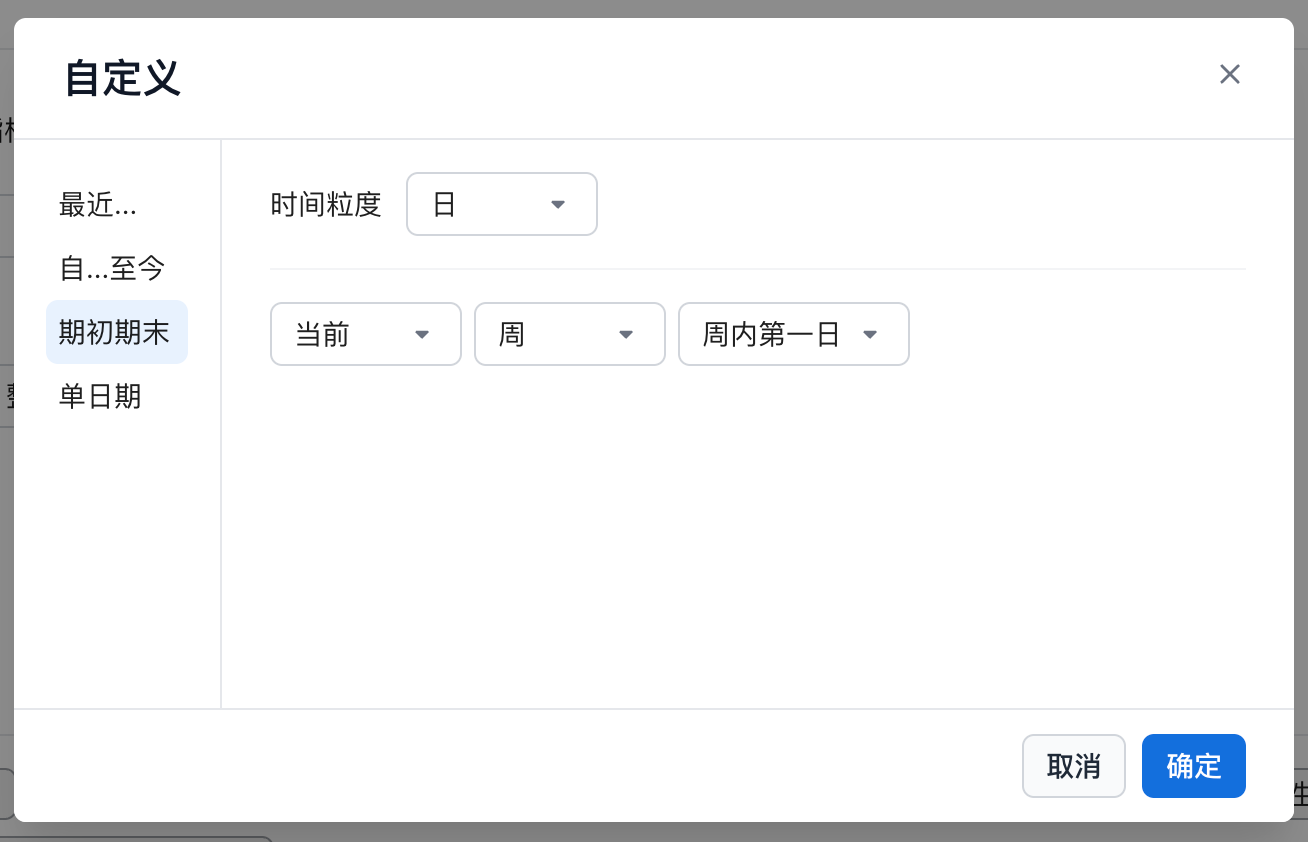 |
Use the Start/End of Period mode to define a statistical date. This is suitable for returning a metric value at a specific point in time.- Day granularity - last day of the month after subtracting 1 month- If the reference date is 2024-05-20, the statistical date is 2024-05-31.- Month granularity - first month of the current year- If the reference date is 2024-05-20, the statistical date is 2024-01. |
|---|---|
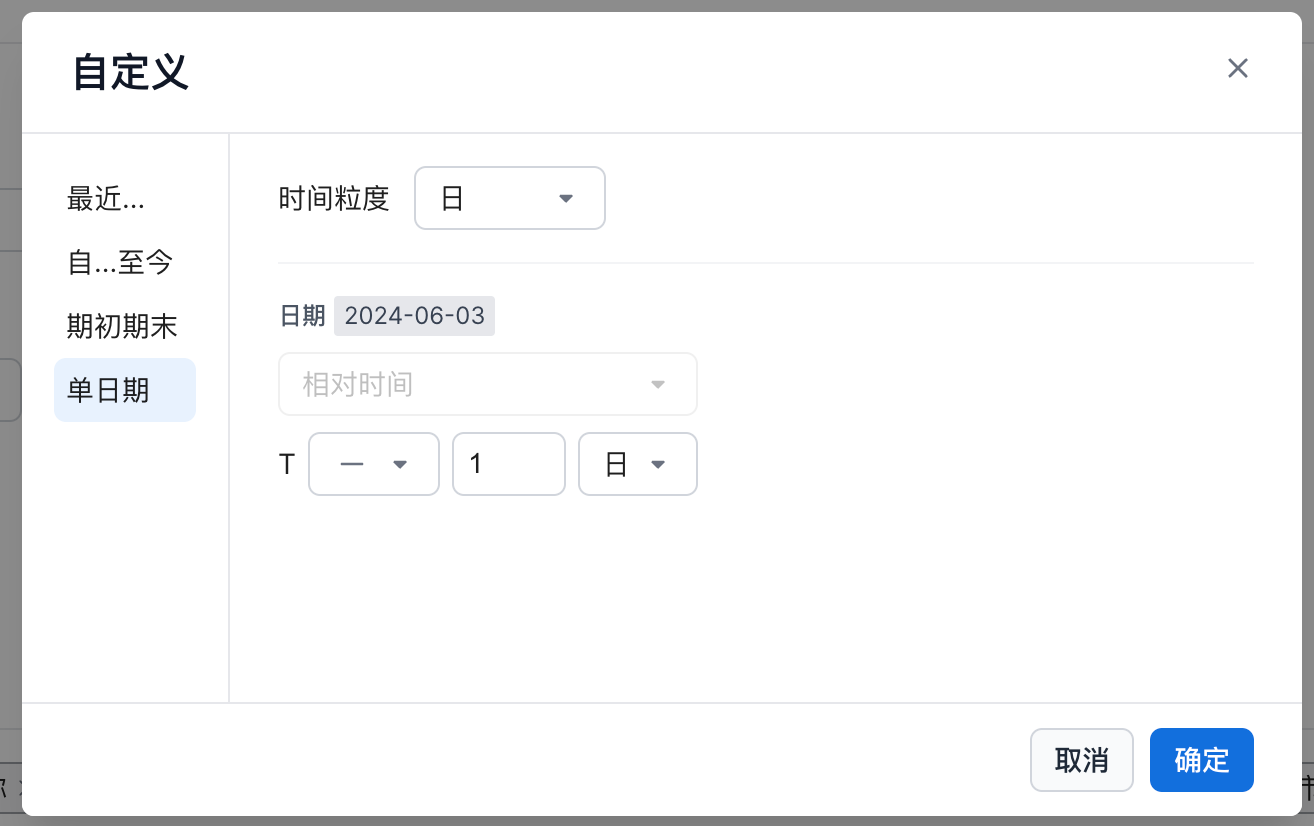 |
Use the Single Date mode to define a statistical date. This is suitable for viewing a specific time such as last month or yesterday. - Day granularity - T-1 day- If the reference date is 2024-05-20, the statistical date is 2024-05-19.- Day granularity - T-1 month- If the reference date is 2024-05-20, the statistical date is 2024-04-20.- Month granularity - T-1 year- If the reference date is 2024-05-20, the statistical date is 2023-05. |
|---|---|
 |
Calculation method - Total: the sum of data within the selected time range. - Average: the average daily value within a time range, calculated as total divided by number of days. - Peak: the highest daily value observed within the selected time range. - Trough: the lowest daily value recorded within the selected time range. |
|---|---|
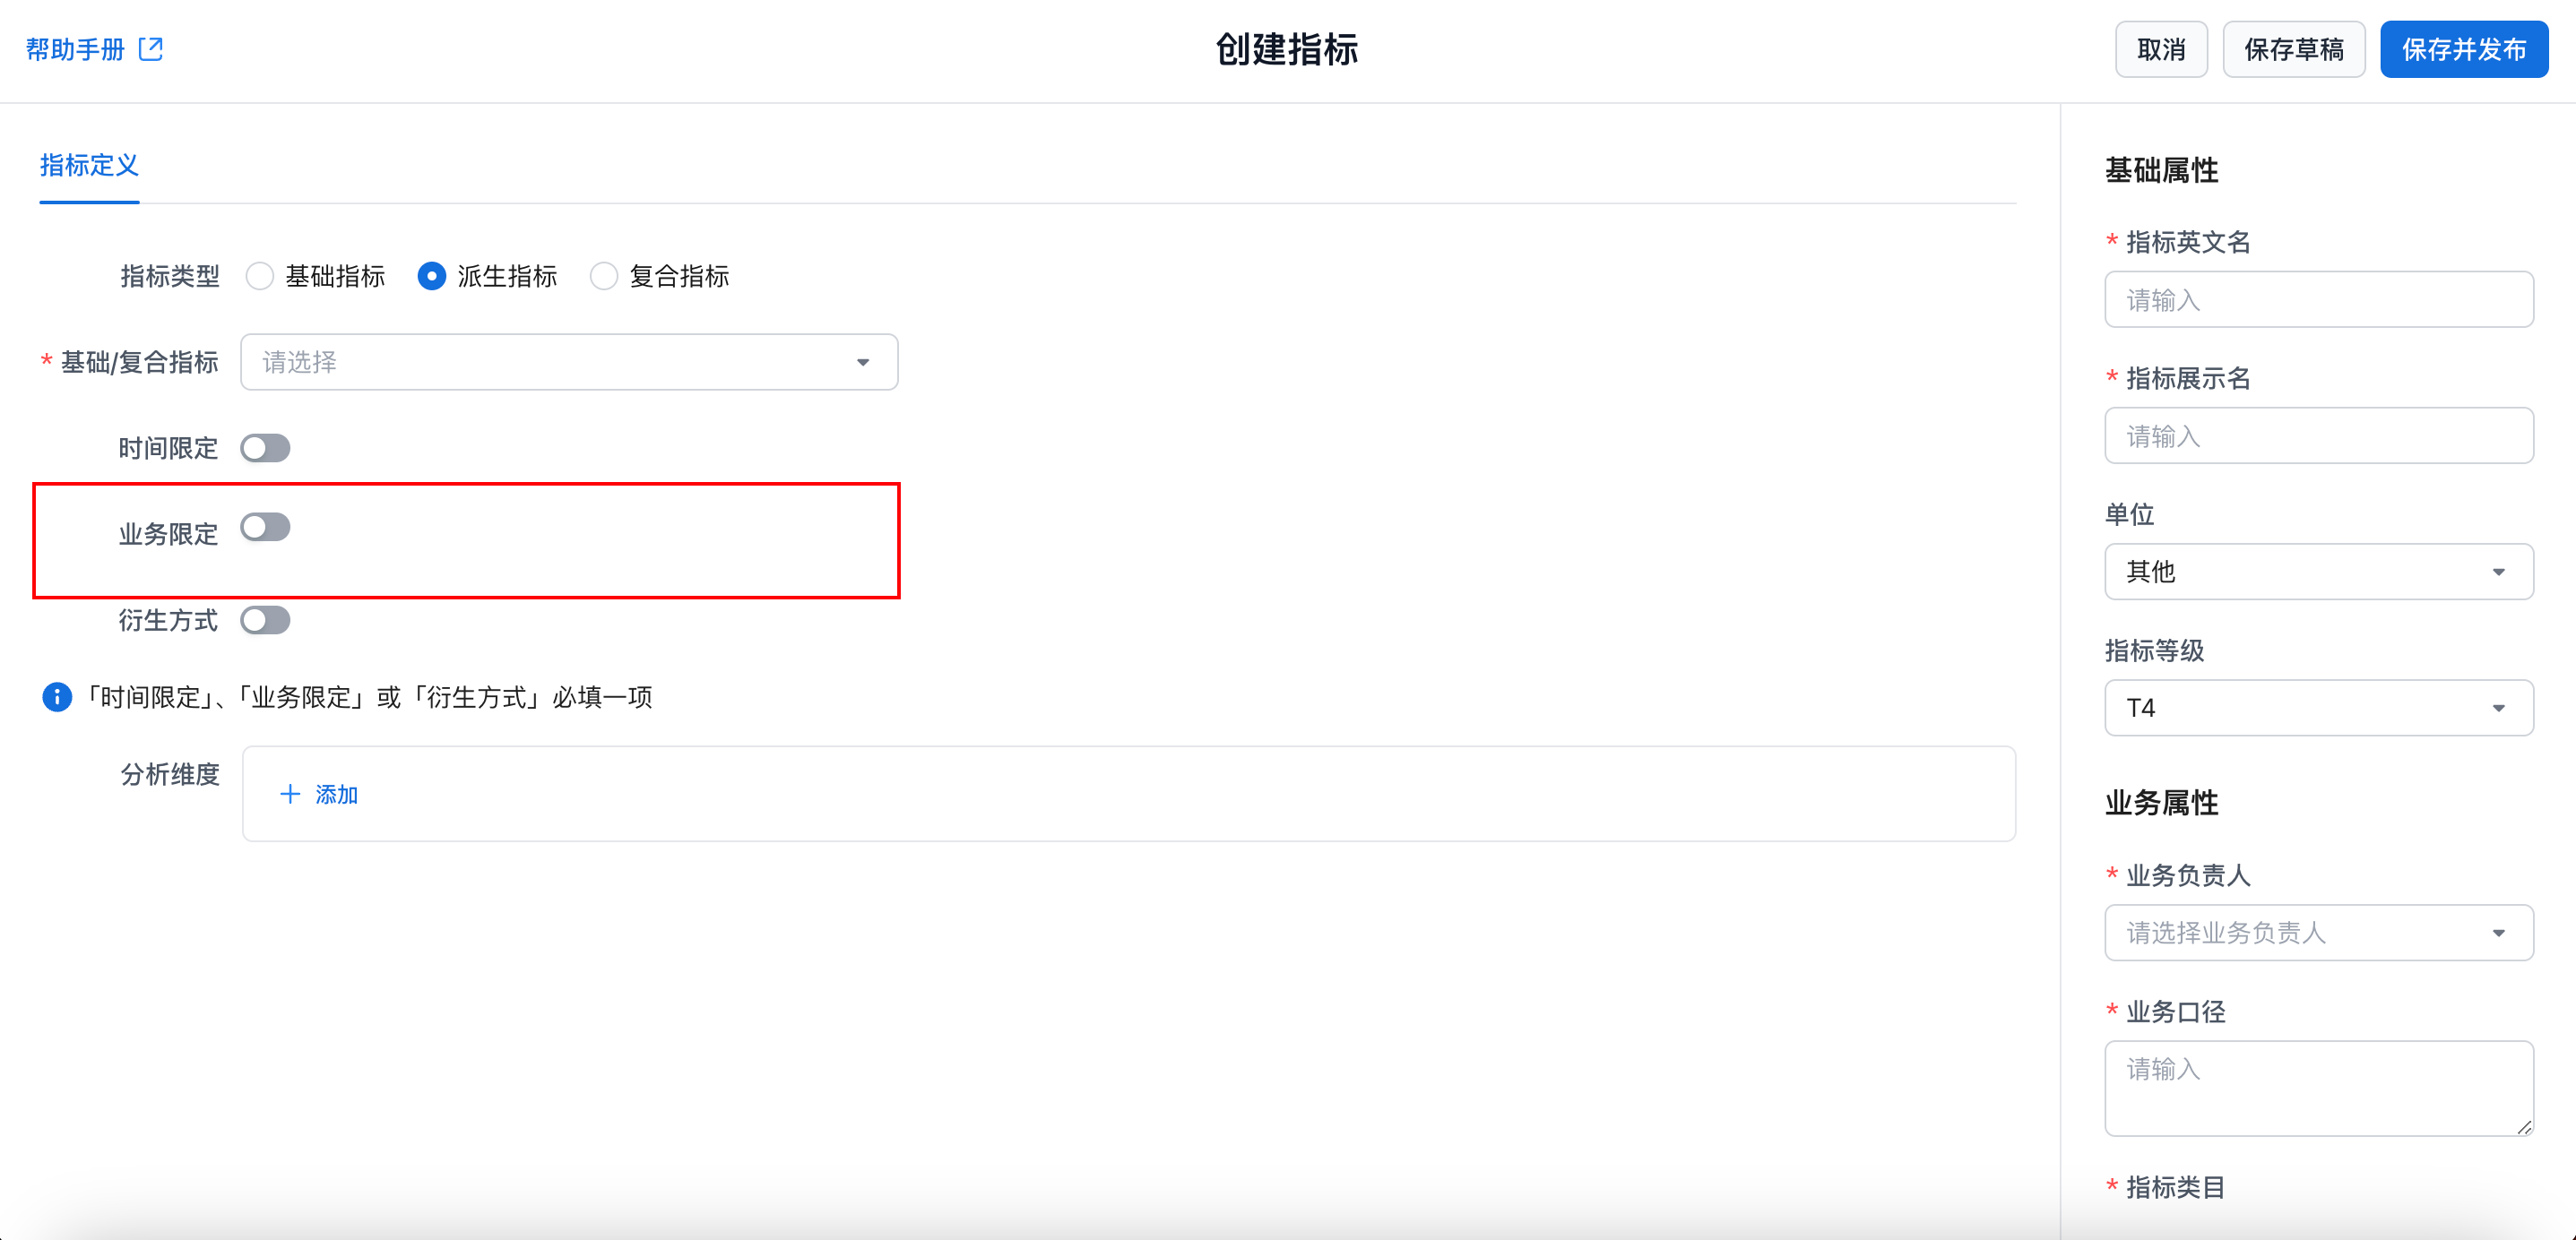
Detailed configuration for business filters:
- Regular: filter by the dimensions available for analysis in the selected basic metric.
 |
Different field types support different matching rules: - Text - Equals or does not equal: supports selecting multiple values, and multiple values are treated as OR. - Contains or does not contain: matches values that contain the specified text. - Starts or does not start with / ends or does not end with: matches the beginning or end of the value. - Numeric fields, including integers and decimals - Equals or does not equal: matches the specified value. - Greater than, less than, greater than or equal to, less than or equal to, between, and outside range: matches values within the selected numeric range. - Time fields, including date and datetime - Specified time: matches a single date value. - Time range: matches dates within the selected range, including the selected minimum and maximum dates. - Outside range: matches dates outside the selected range, excluding the selected minimum and maximum dates. - Earlier than or later than: matches dates before or after the specified date, excluding the selected date. |
|---|---|
- Custom Expression: use a filter expression. The metric is calculated from the filtered data.
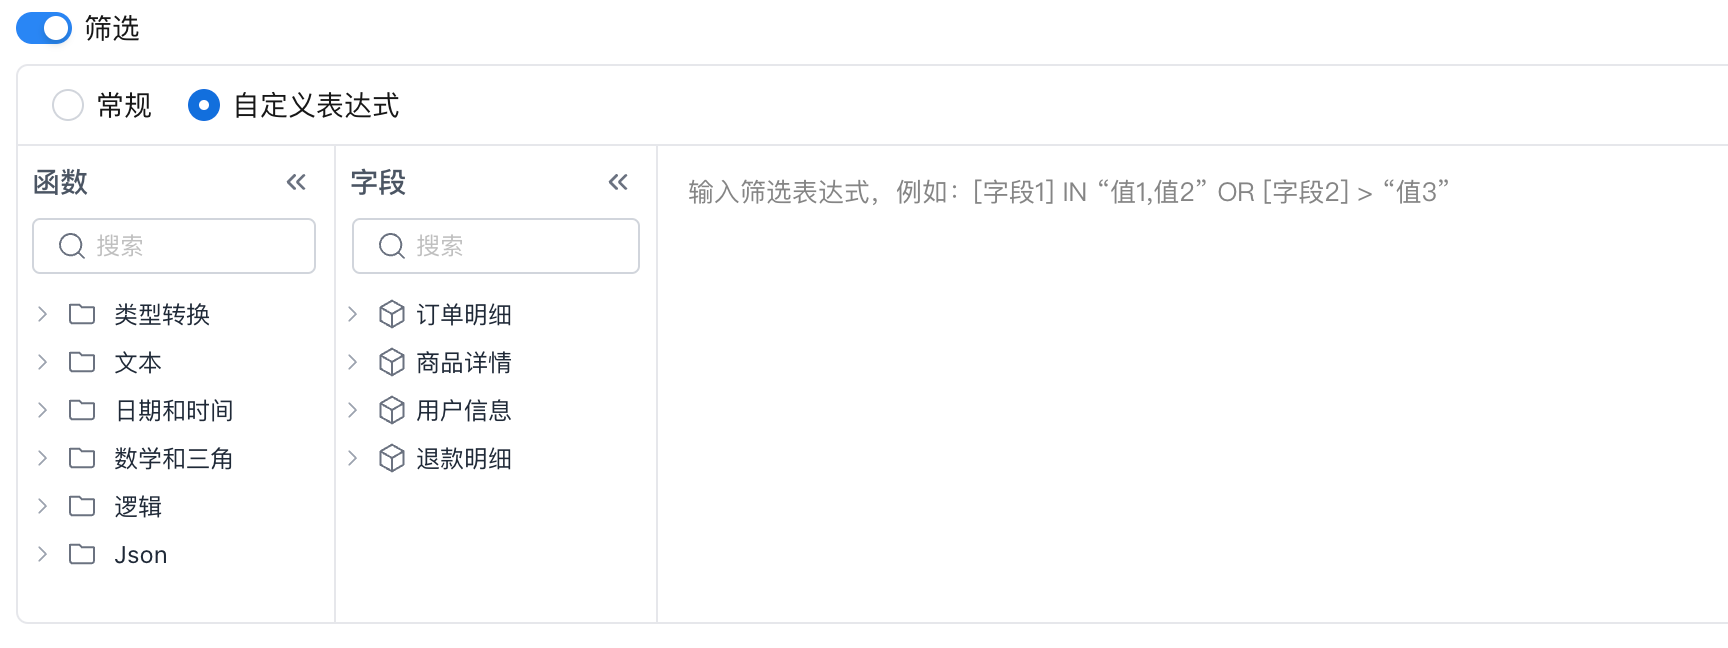 |
Use AND and OR to combine multiple conditions.- Keep orders from the past 7 days sql<br>[Order Table/Order Date] >= Dateadd(Today(),-6,"DAY") AND [Order Table/Order Date] <= Today()<br>- Keep paid orders or unpaid orders from third-party channels sql<br>[Order Table/Order Status]="Paid" OR ([Order Table/Order Status]="Unpaid" AND In([Payment Channel/Channel],"Alipay","WeChat Pay","UnionPay"))<br> |
|---|---|
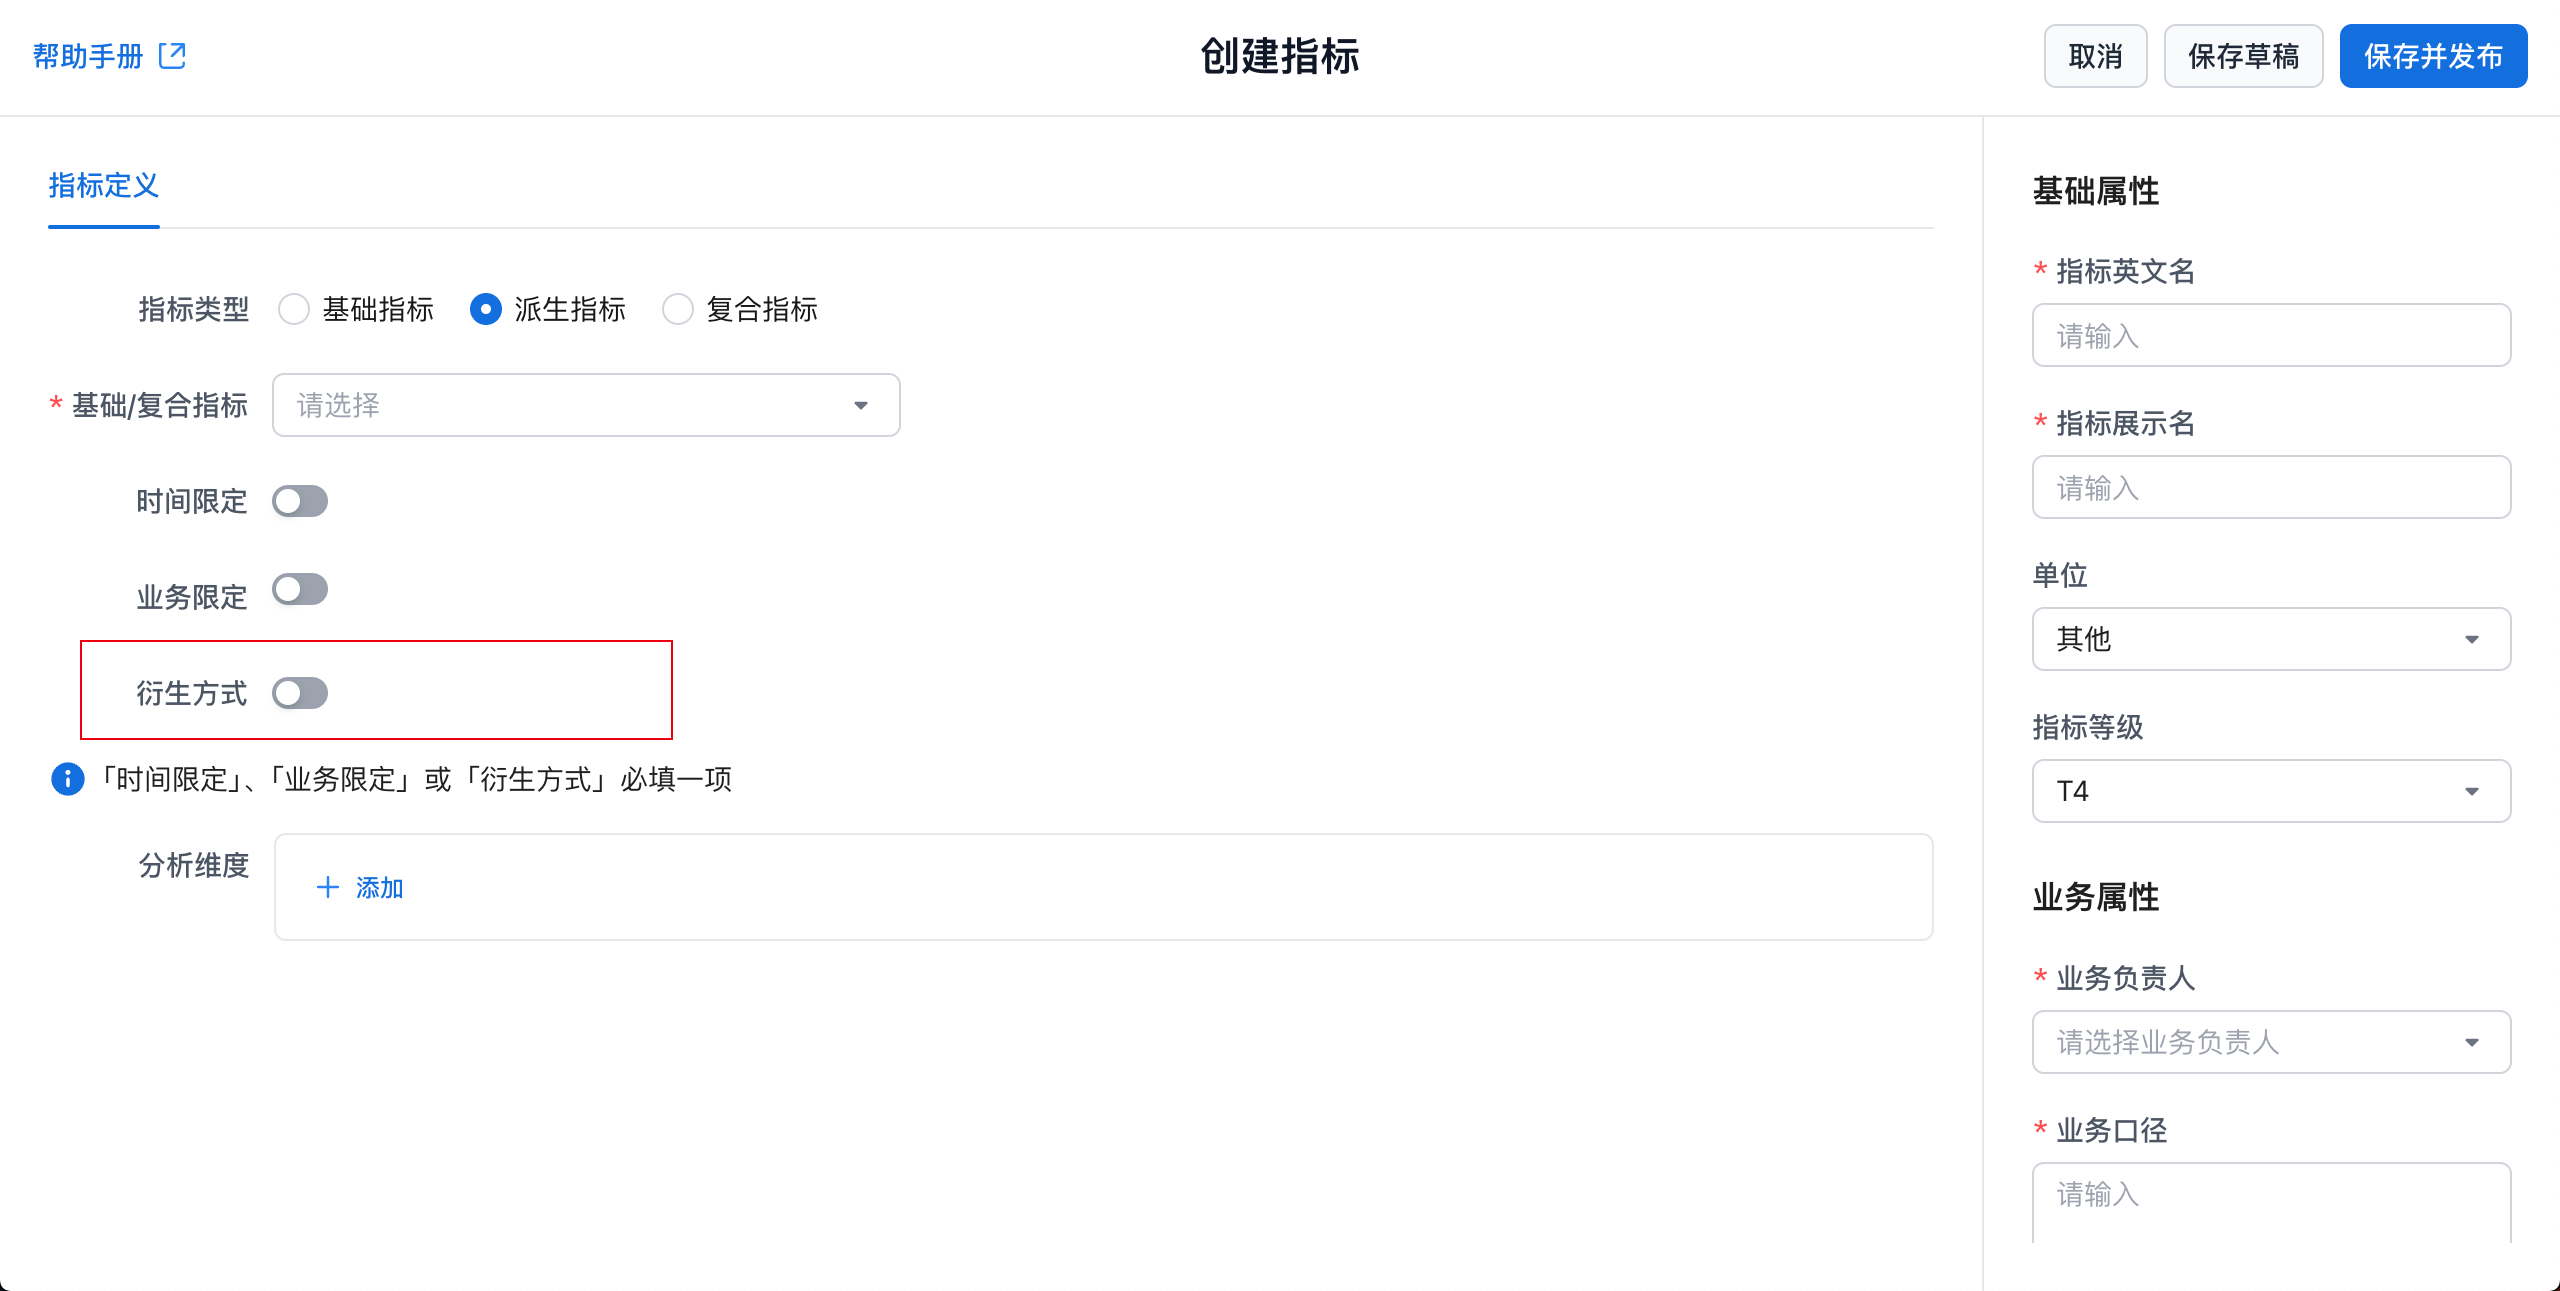
Set Derivation Method
| Configuration Item | Description | ||||
|---|---|---|---|---|---|
| Derivation Method | Year-over-year / period-over-period | Type | 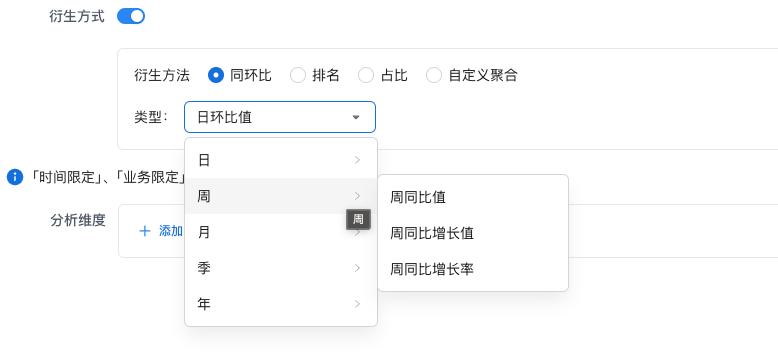 |
Currently supported comparisons by time granularity: ● Day: period-over-period value, period-over-period growth value, period-over-period growth rate ● Week/month/quarter/year: year-over-year value, year-over-year growth rate, year-over-year growth value |
|
| Ranking | Ranking Range |  |
The window used to calculate the ranking. | ||
| Ranking Dimension |  |
Similar to the percentage-share dimension. If a filter contains this dimension, the filter is ignored when calculating the ranking. | |||
| Ranking Method | 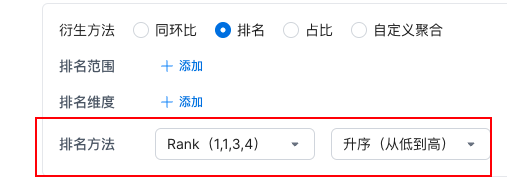 Supported ranking methods: * Rank: 1,1,3,4 * RankDense: 1,1,2,3 * RowNumber: 1,2,3,4 Supported ranking methods: * Rank: 1,1,3,4 * RankDense: 1,1,2,3 * RowNumber: 1,2,3,4 |
Supported ranking methods: ● Rank: 1,1,3,4 ● RankDense: 1,1,2,3 ● RowNumber: 1,2,3,4 |
|||
| Percentage Share | Share Range |  |
The dimensions used as the denominator when calculating the percentage share. If this parameter is configured, the dimension must be included in analysis. For Metric Date, use metric_time.Example: if Share Range is Province, the metric is Orders, and the analysis dimensions are province, city, and district, the metric calculates each district's share of orders within its province. |
||
| Share Dimension |  |
If Share Dimension is configured, the dimension must be included in the query. If a filter contains this dimension, the filter is ignored when calculating the denominator. Example: Jiangsu Province has orders in Nanjing and Suzhou, with values 10 and 40 respectively. Share Range: Province Share Dimension: City If the filter is city = Suzhou, Suzhou's share is 80%. If Share Dimension does not include City, the share is 100%. |
|||
| Custom Aggregation |  |
Click the drop-down list to select an aggregation method: a. Average, maximum, minimum |
Note
Period-over-period comparison compares data with the previous period within a given time cycle. For example, it can compare changes month over month, quarter over quarter, or year over year depending on the selected period.
Year-over-year comparison compares data with the same period in a previous year. For example, it can compare the first quarter of this year with the first quarter of last year.
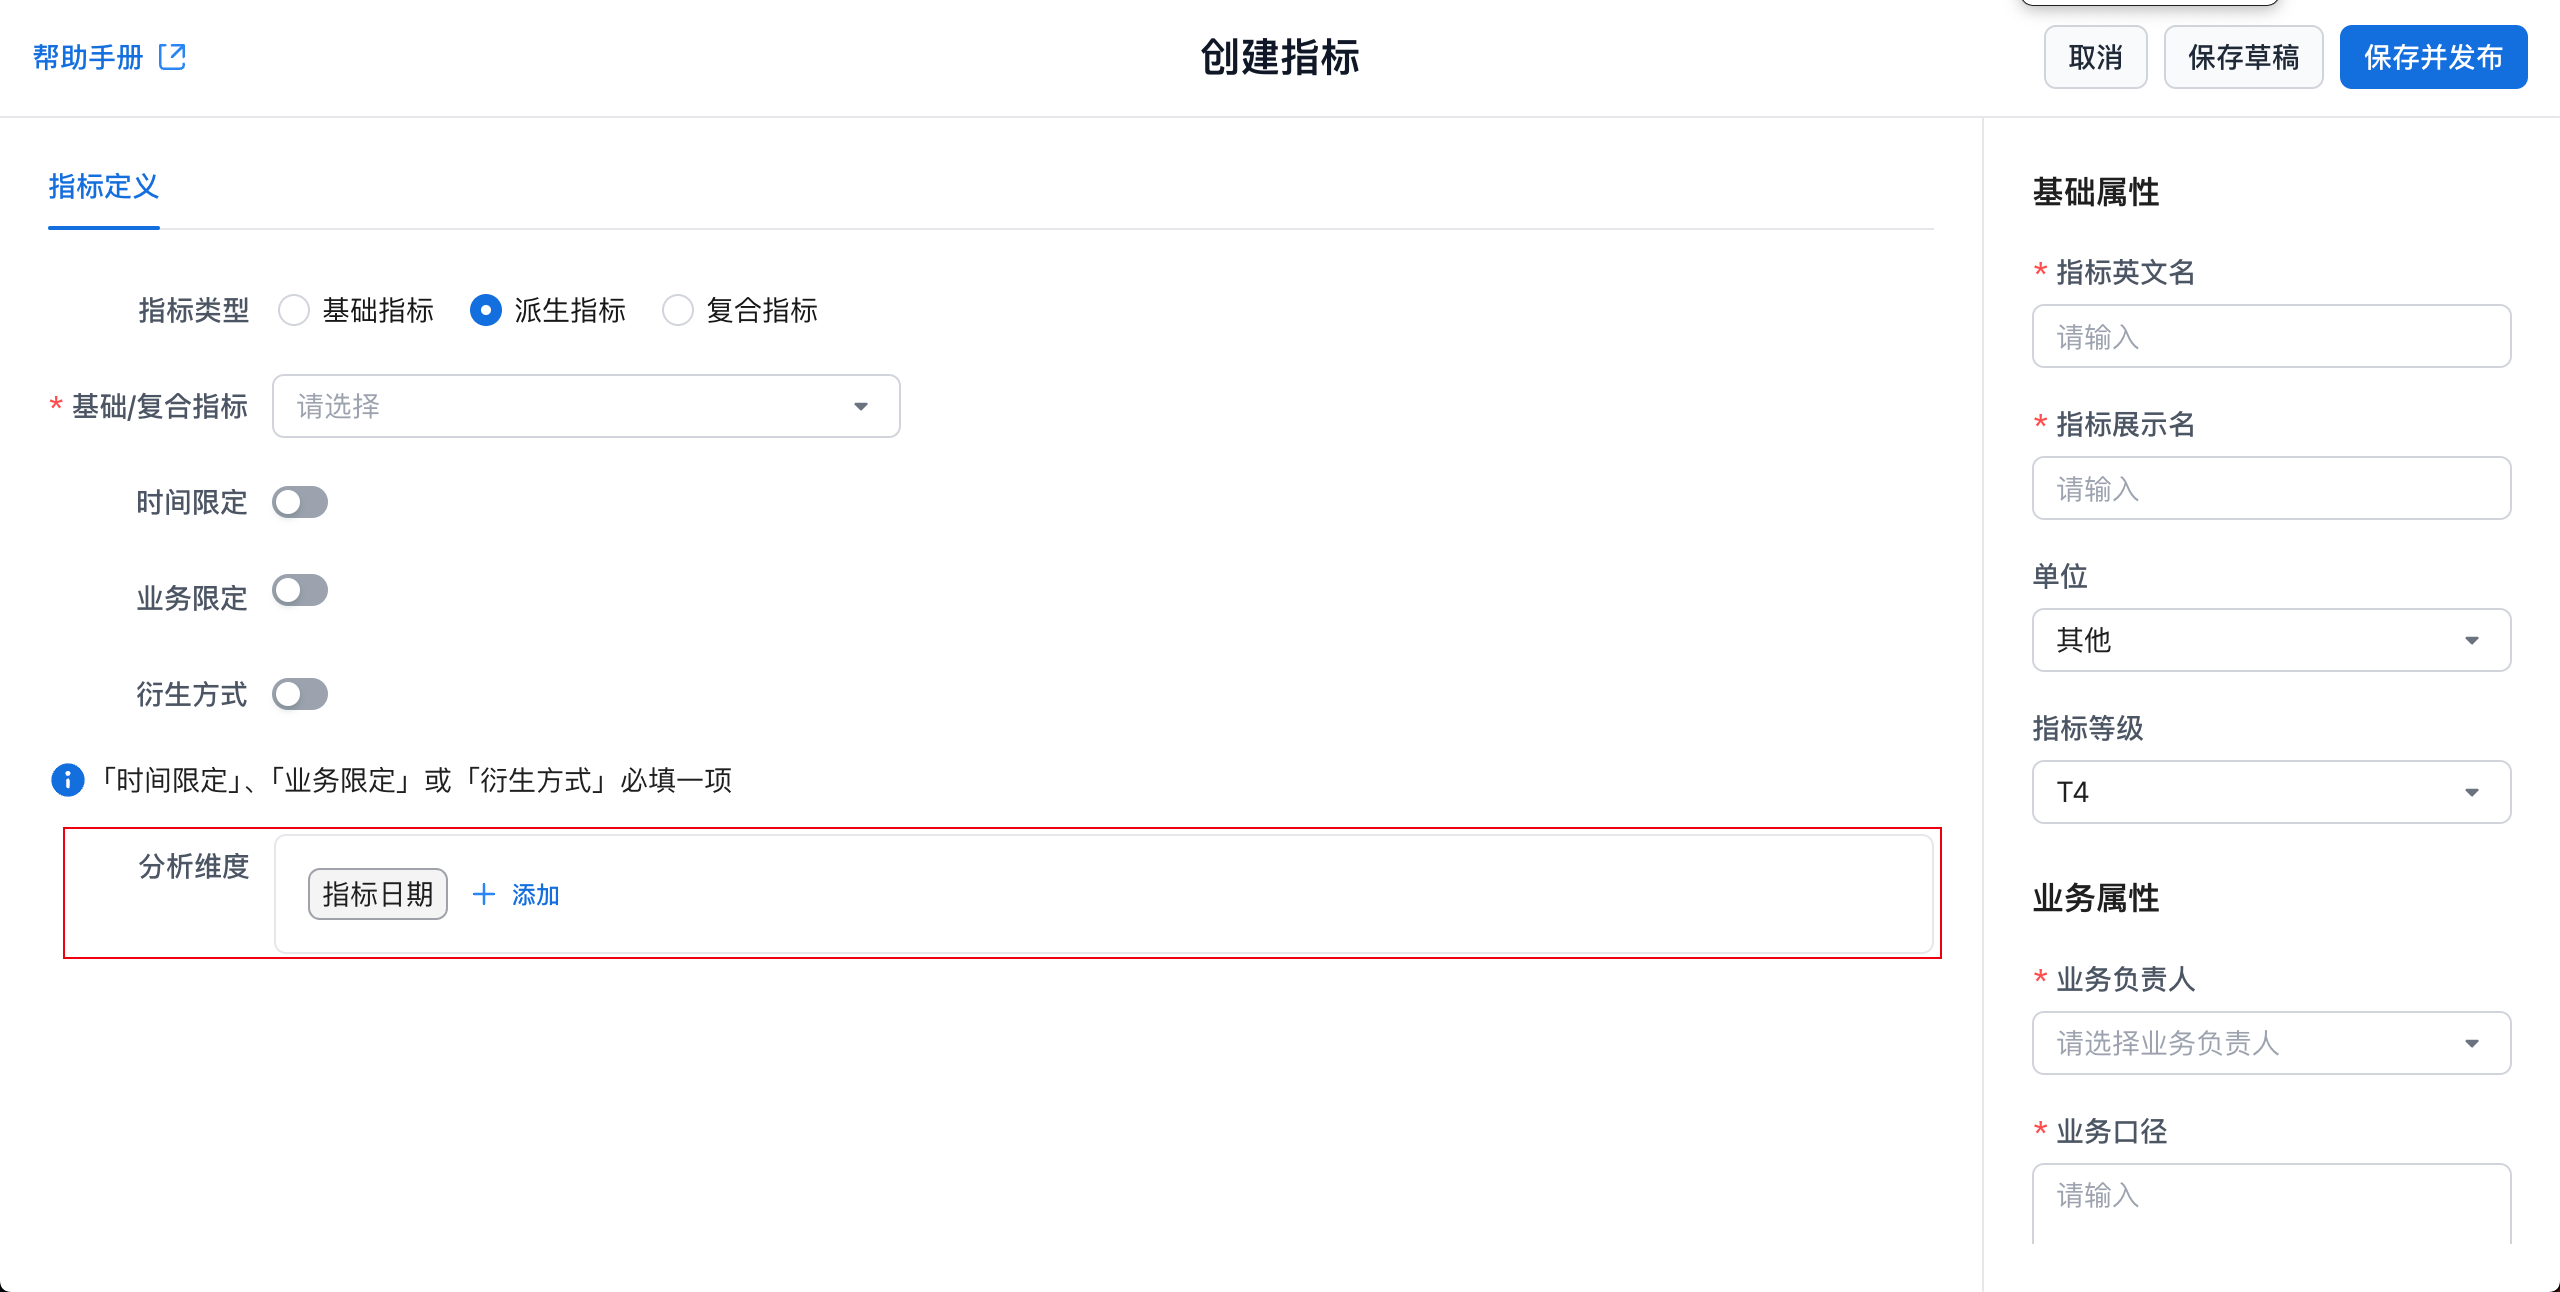
Set Analysis Dimensions
Select the dimensions that can be used to analyze this derived metric. These dimensions can be used for multi-dimensional grouping or filtering.
Tip
Available dimensions for a derived metric come from the available dimensions of its selected basic or composite metric.
Notice
After a derived metric is saved, if the available dimensions of its base metric are changed, the system does not automatically add newly available dimensions to the current metric. You must select them manually.
Configure Metric Properties

Fill in metric property information. Administrators can customize which properties are available and whether they are required. Built-in system properties cannot be customized. Important system properties include:
| Property | Rule |
|---|---|
| Metric Name | Supports English letters, numbers, and underscores (_), and must be globally unique. ::: The metric name cannot be changed after creation. Use the metric name in the query API to retrieve metric results. ::: |
| Metric Display Name | Supports any characters and must be globally unique. |
| Unit | Select the metric unit. |
| Business Owner | The business owner of the metric. Administrators can disable this property. |
| Business Definition | The business definition of the metric, used to describe its calculation scope and business meaning in detail. |
| Metric Category | The metric category. The system provides an Uncategorized category. |
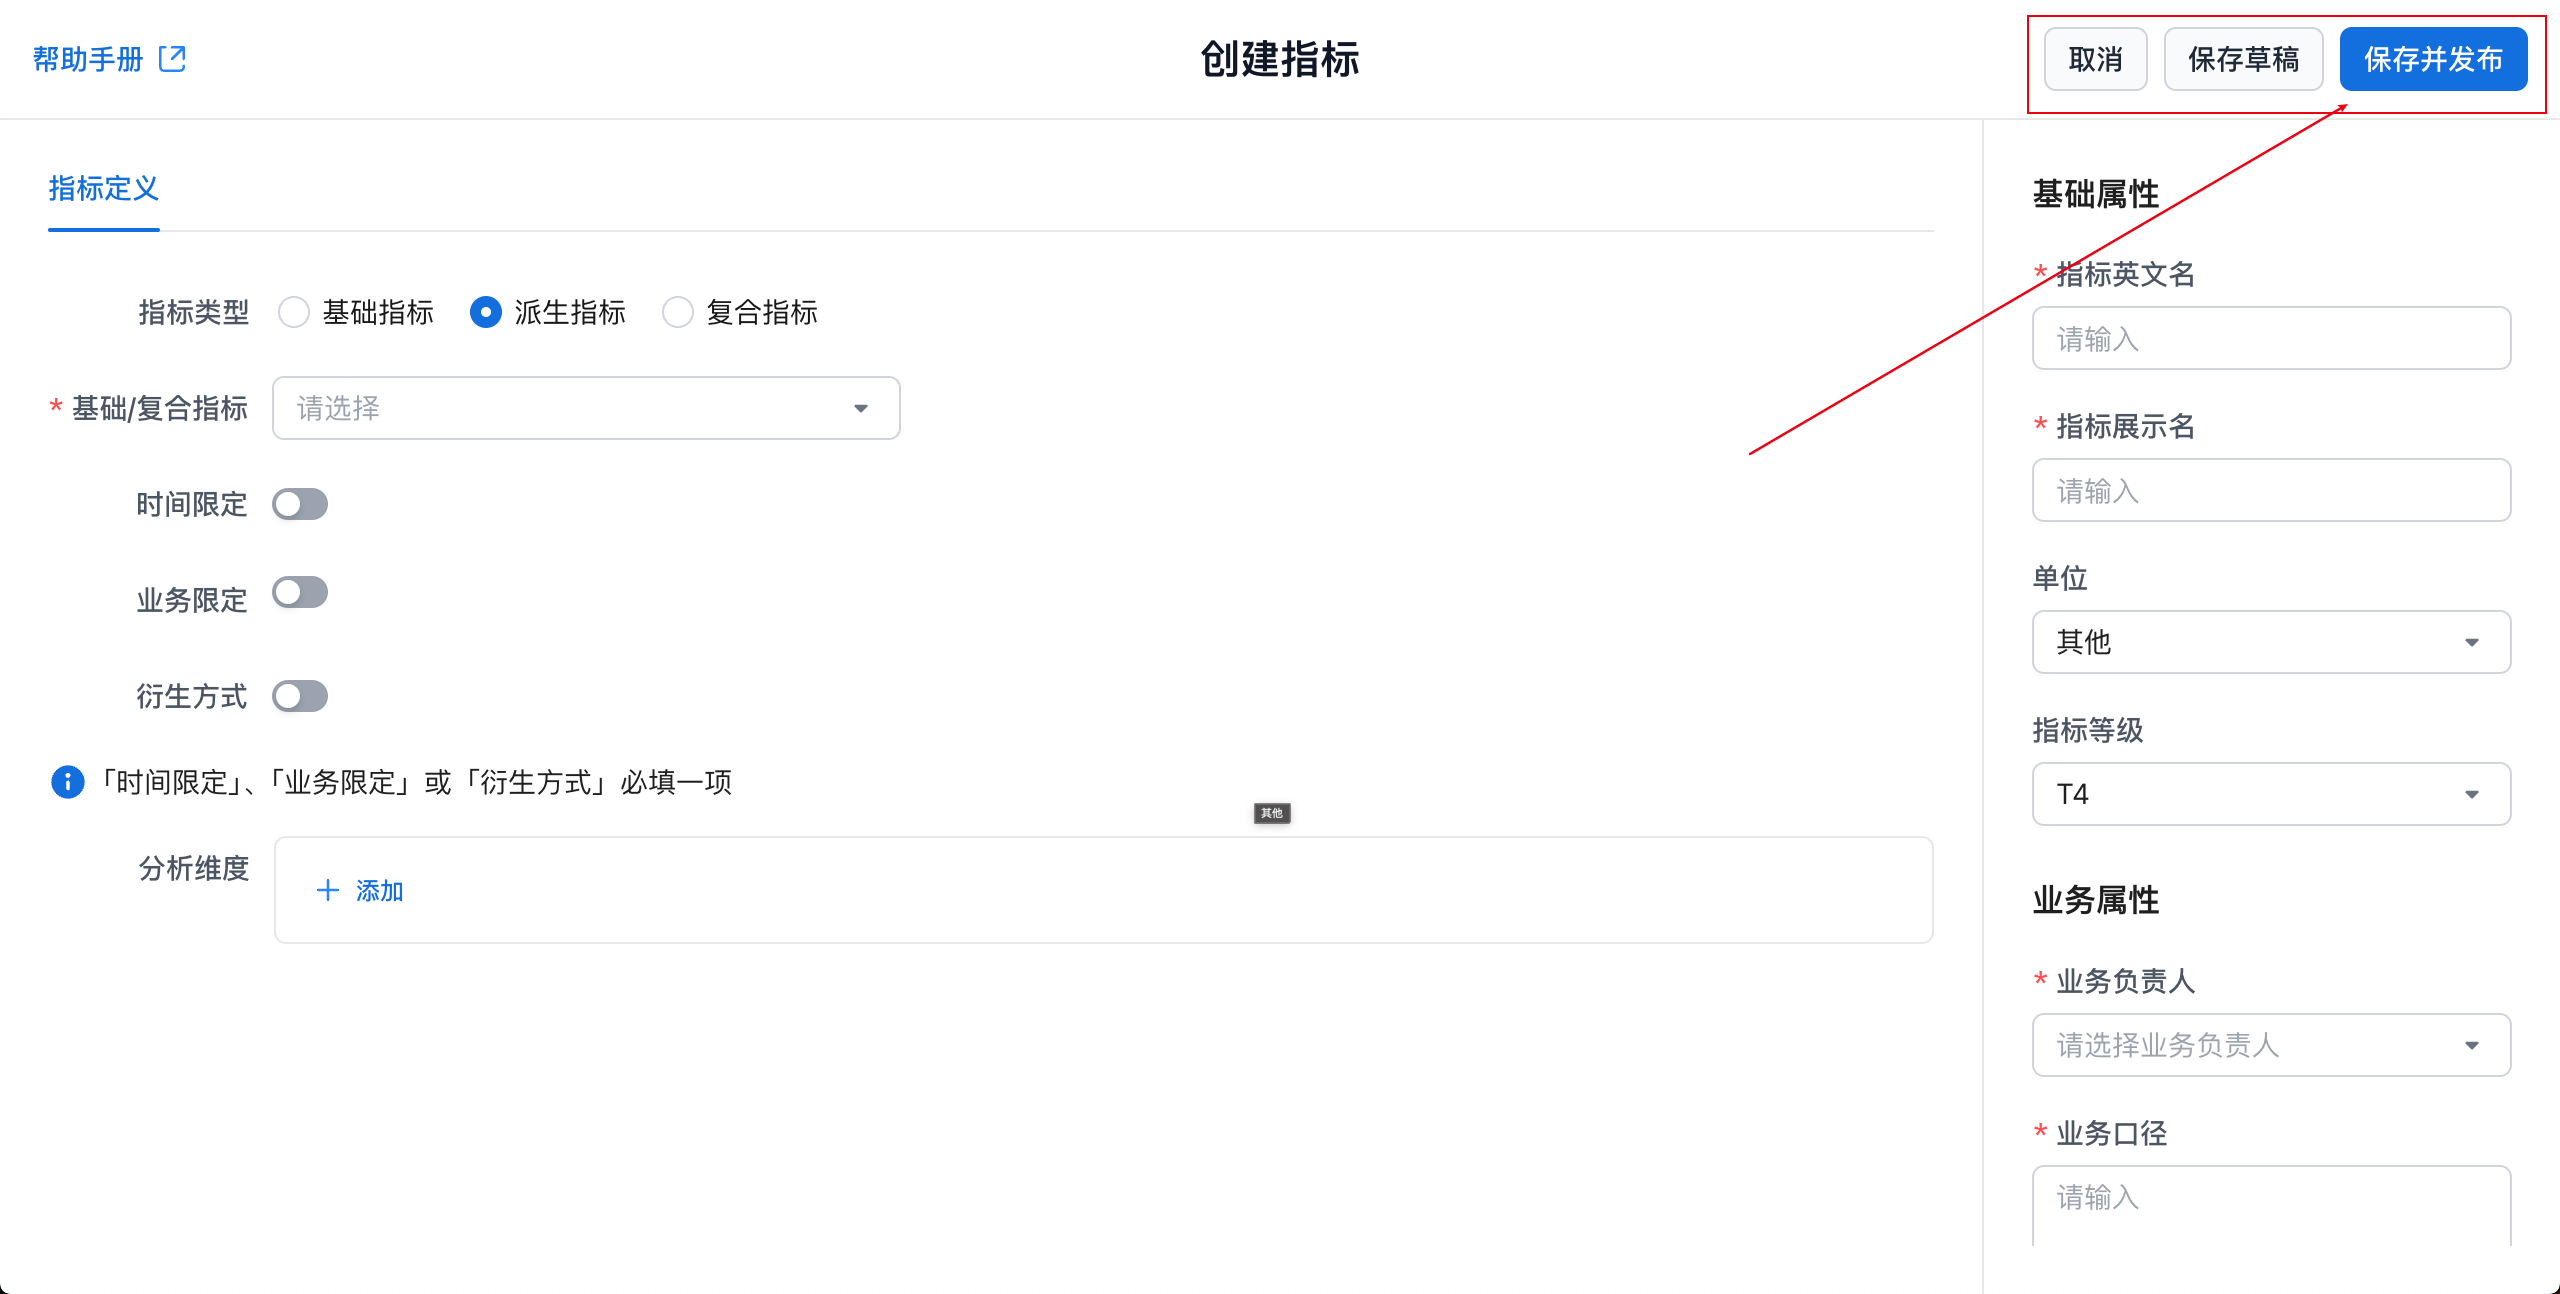
Save or Publish the Metric
| Action | Description |
|---|---|
| Save Draft | Save the current metric definition as a draft. |
| Save and Publish | Publish the current metric. After publishing, other users can query this metric. |