Create a Metric View
This page explains how to create a metric view in the metric platform.
Procedure
Entry Point
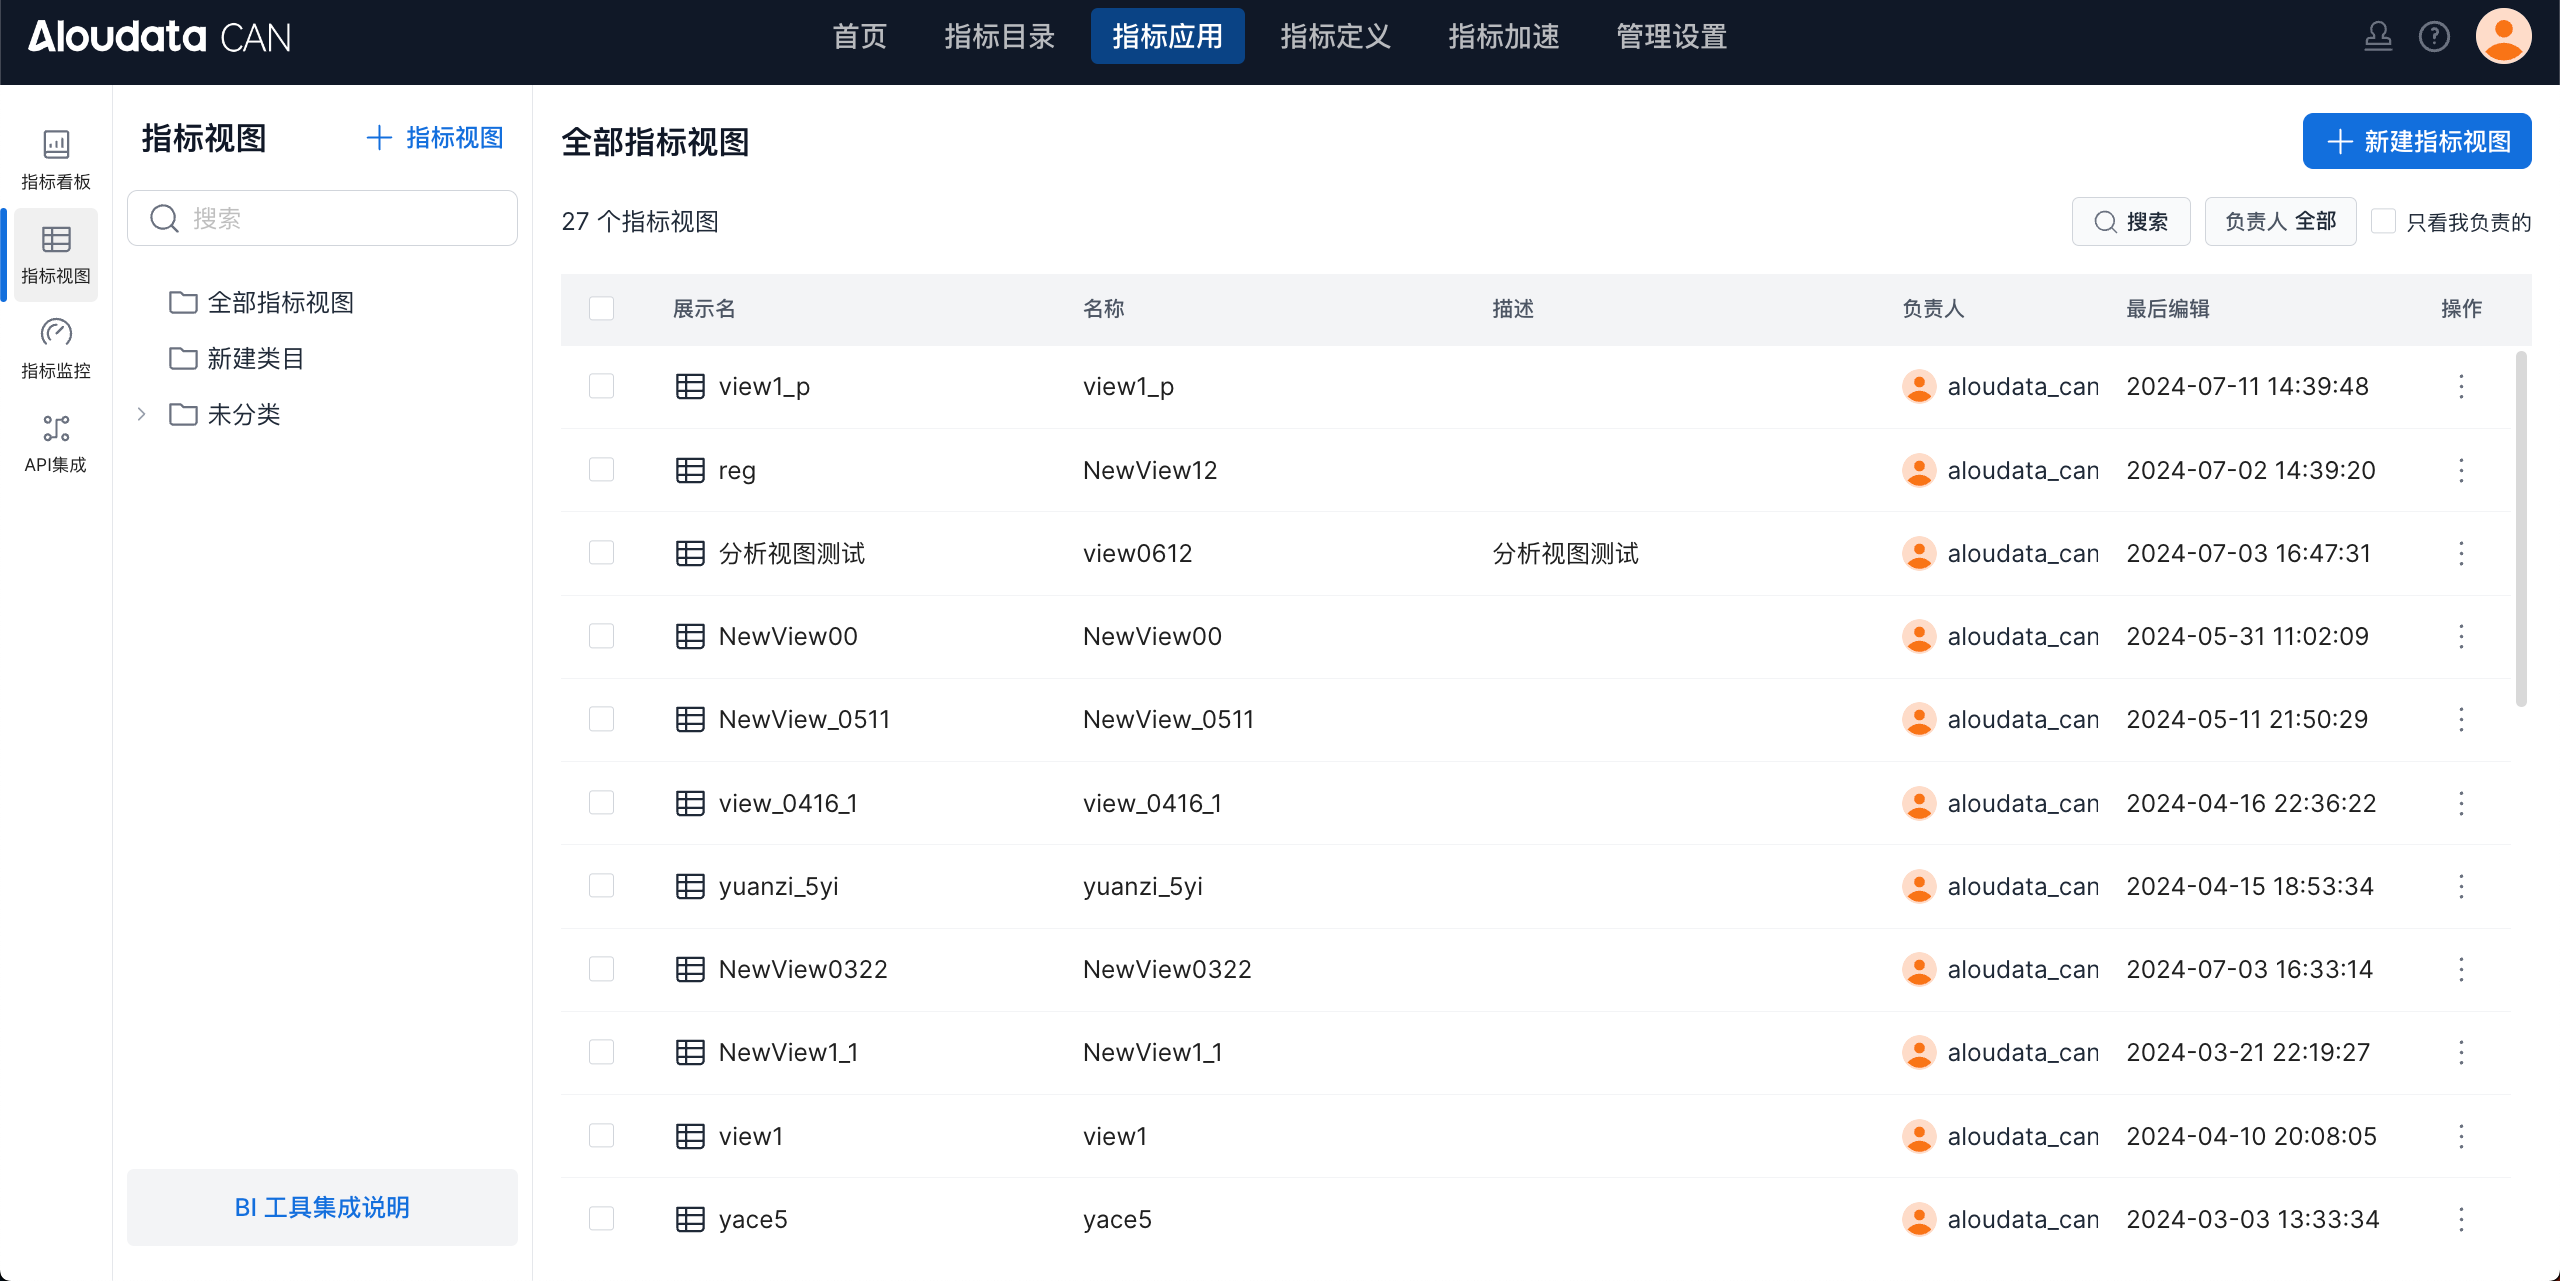
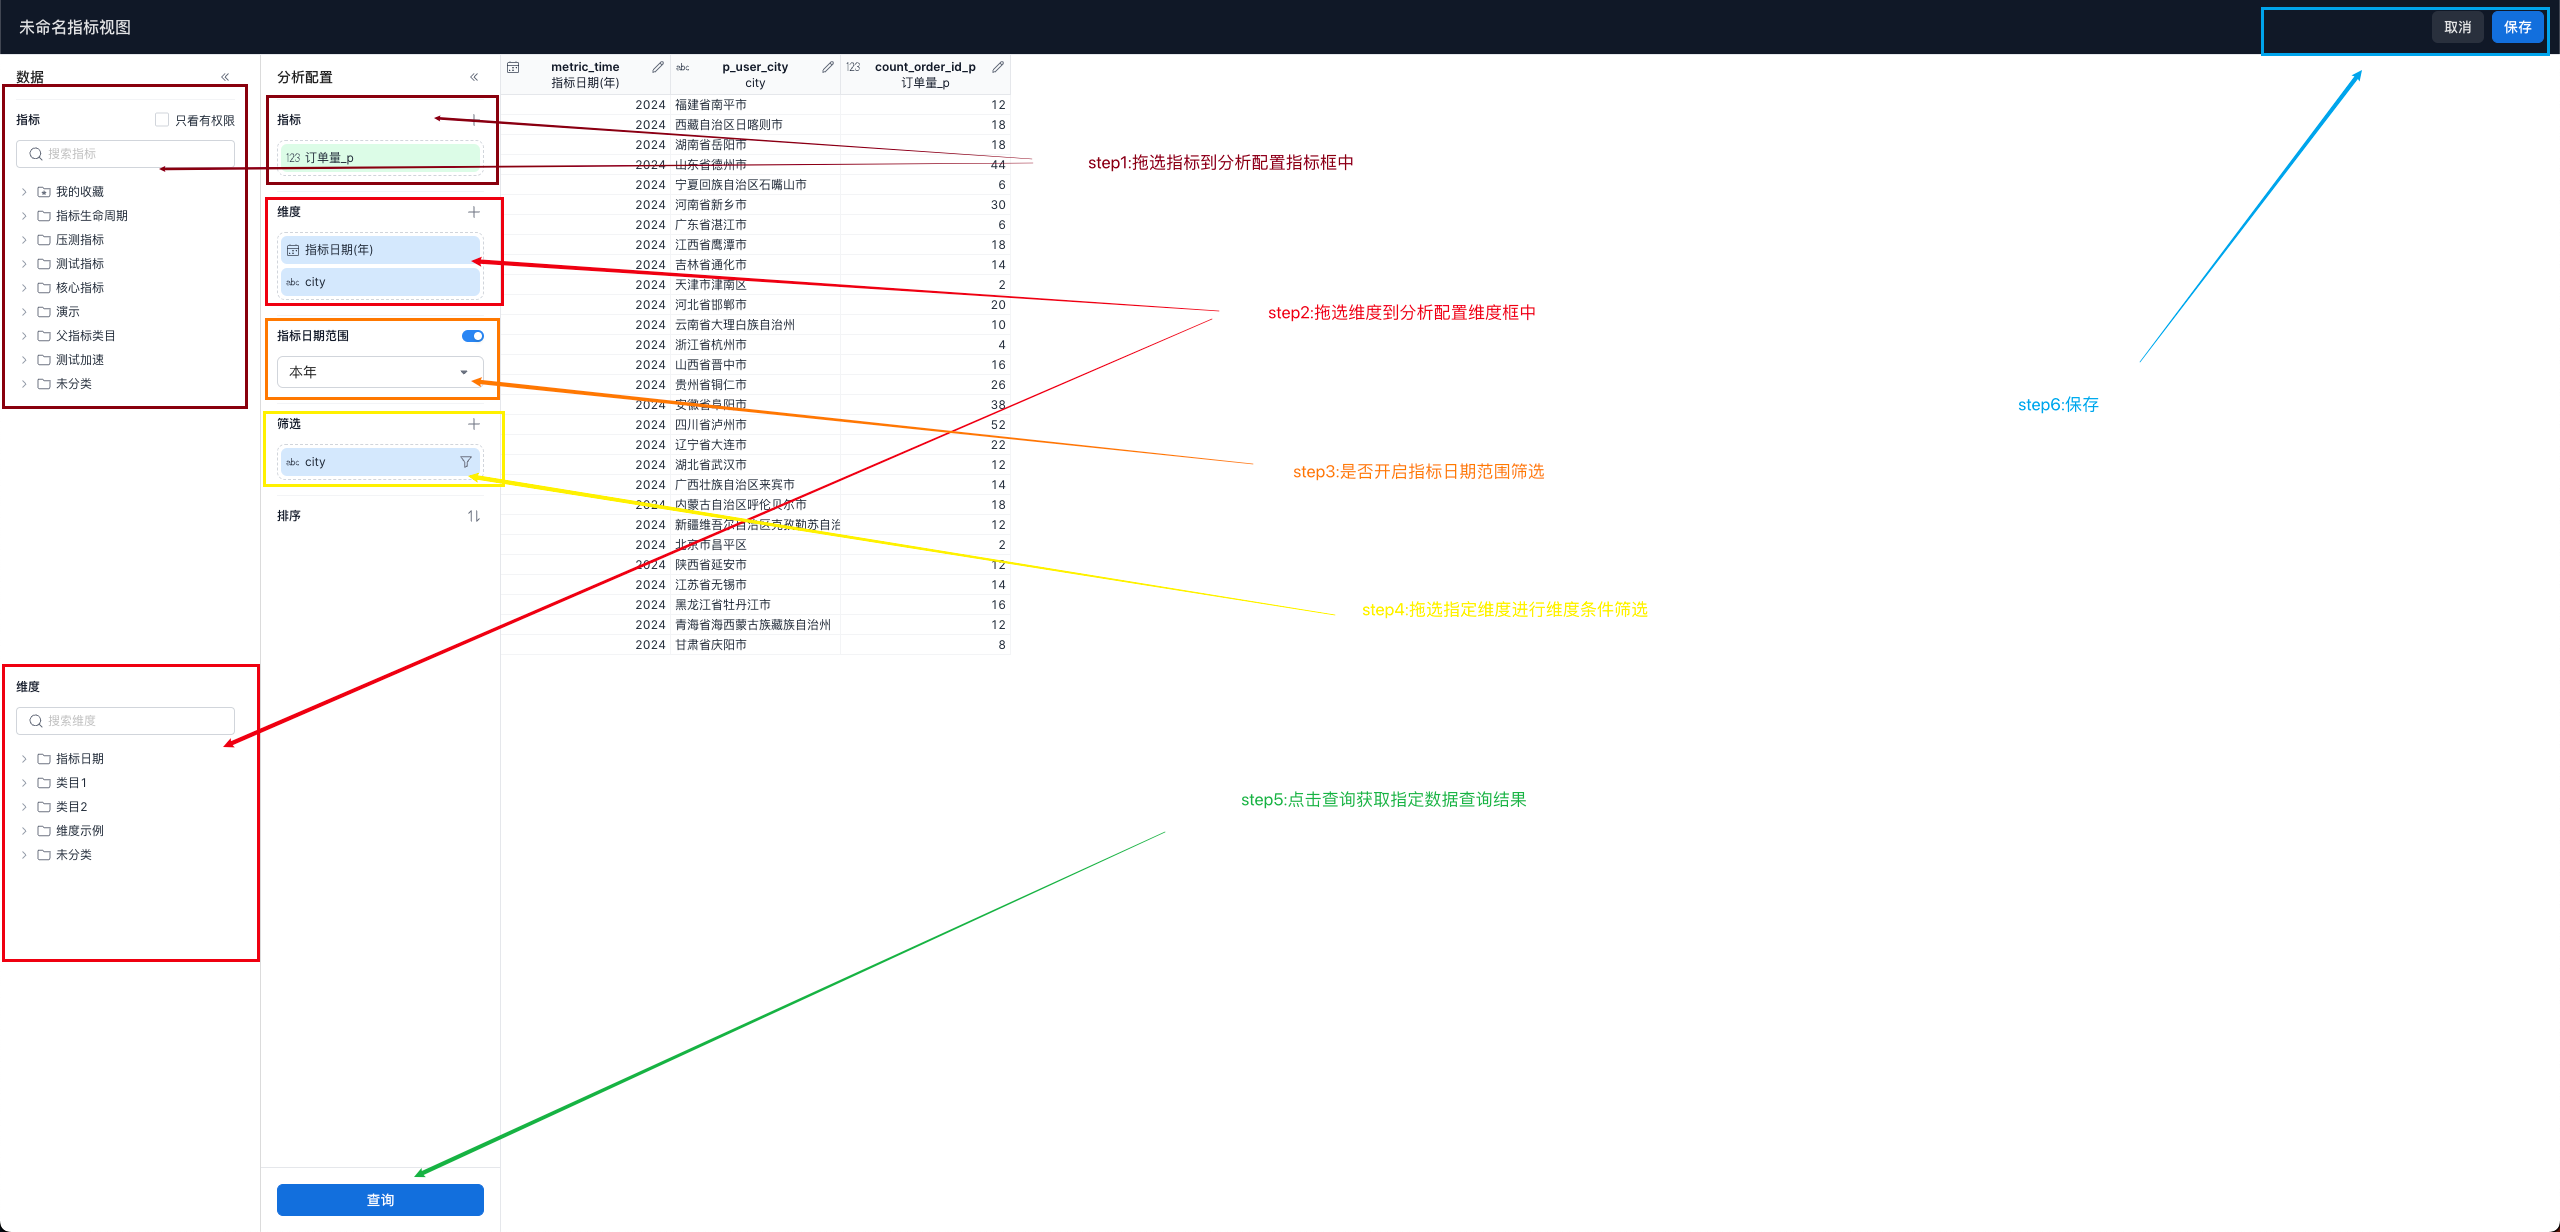
In the top navigation bar, choose Metric Applications, then choose Metric Views in the left navigation bar. In the upper-right corner of the metric views page, click Create Metric View to open the metric view creation page, as shown below:
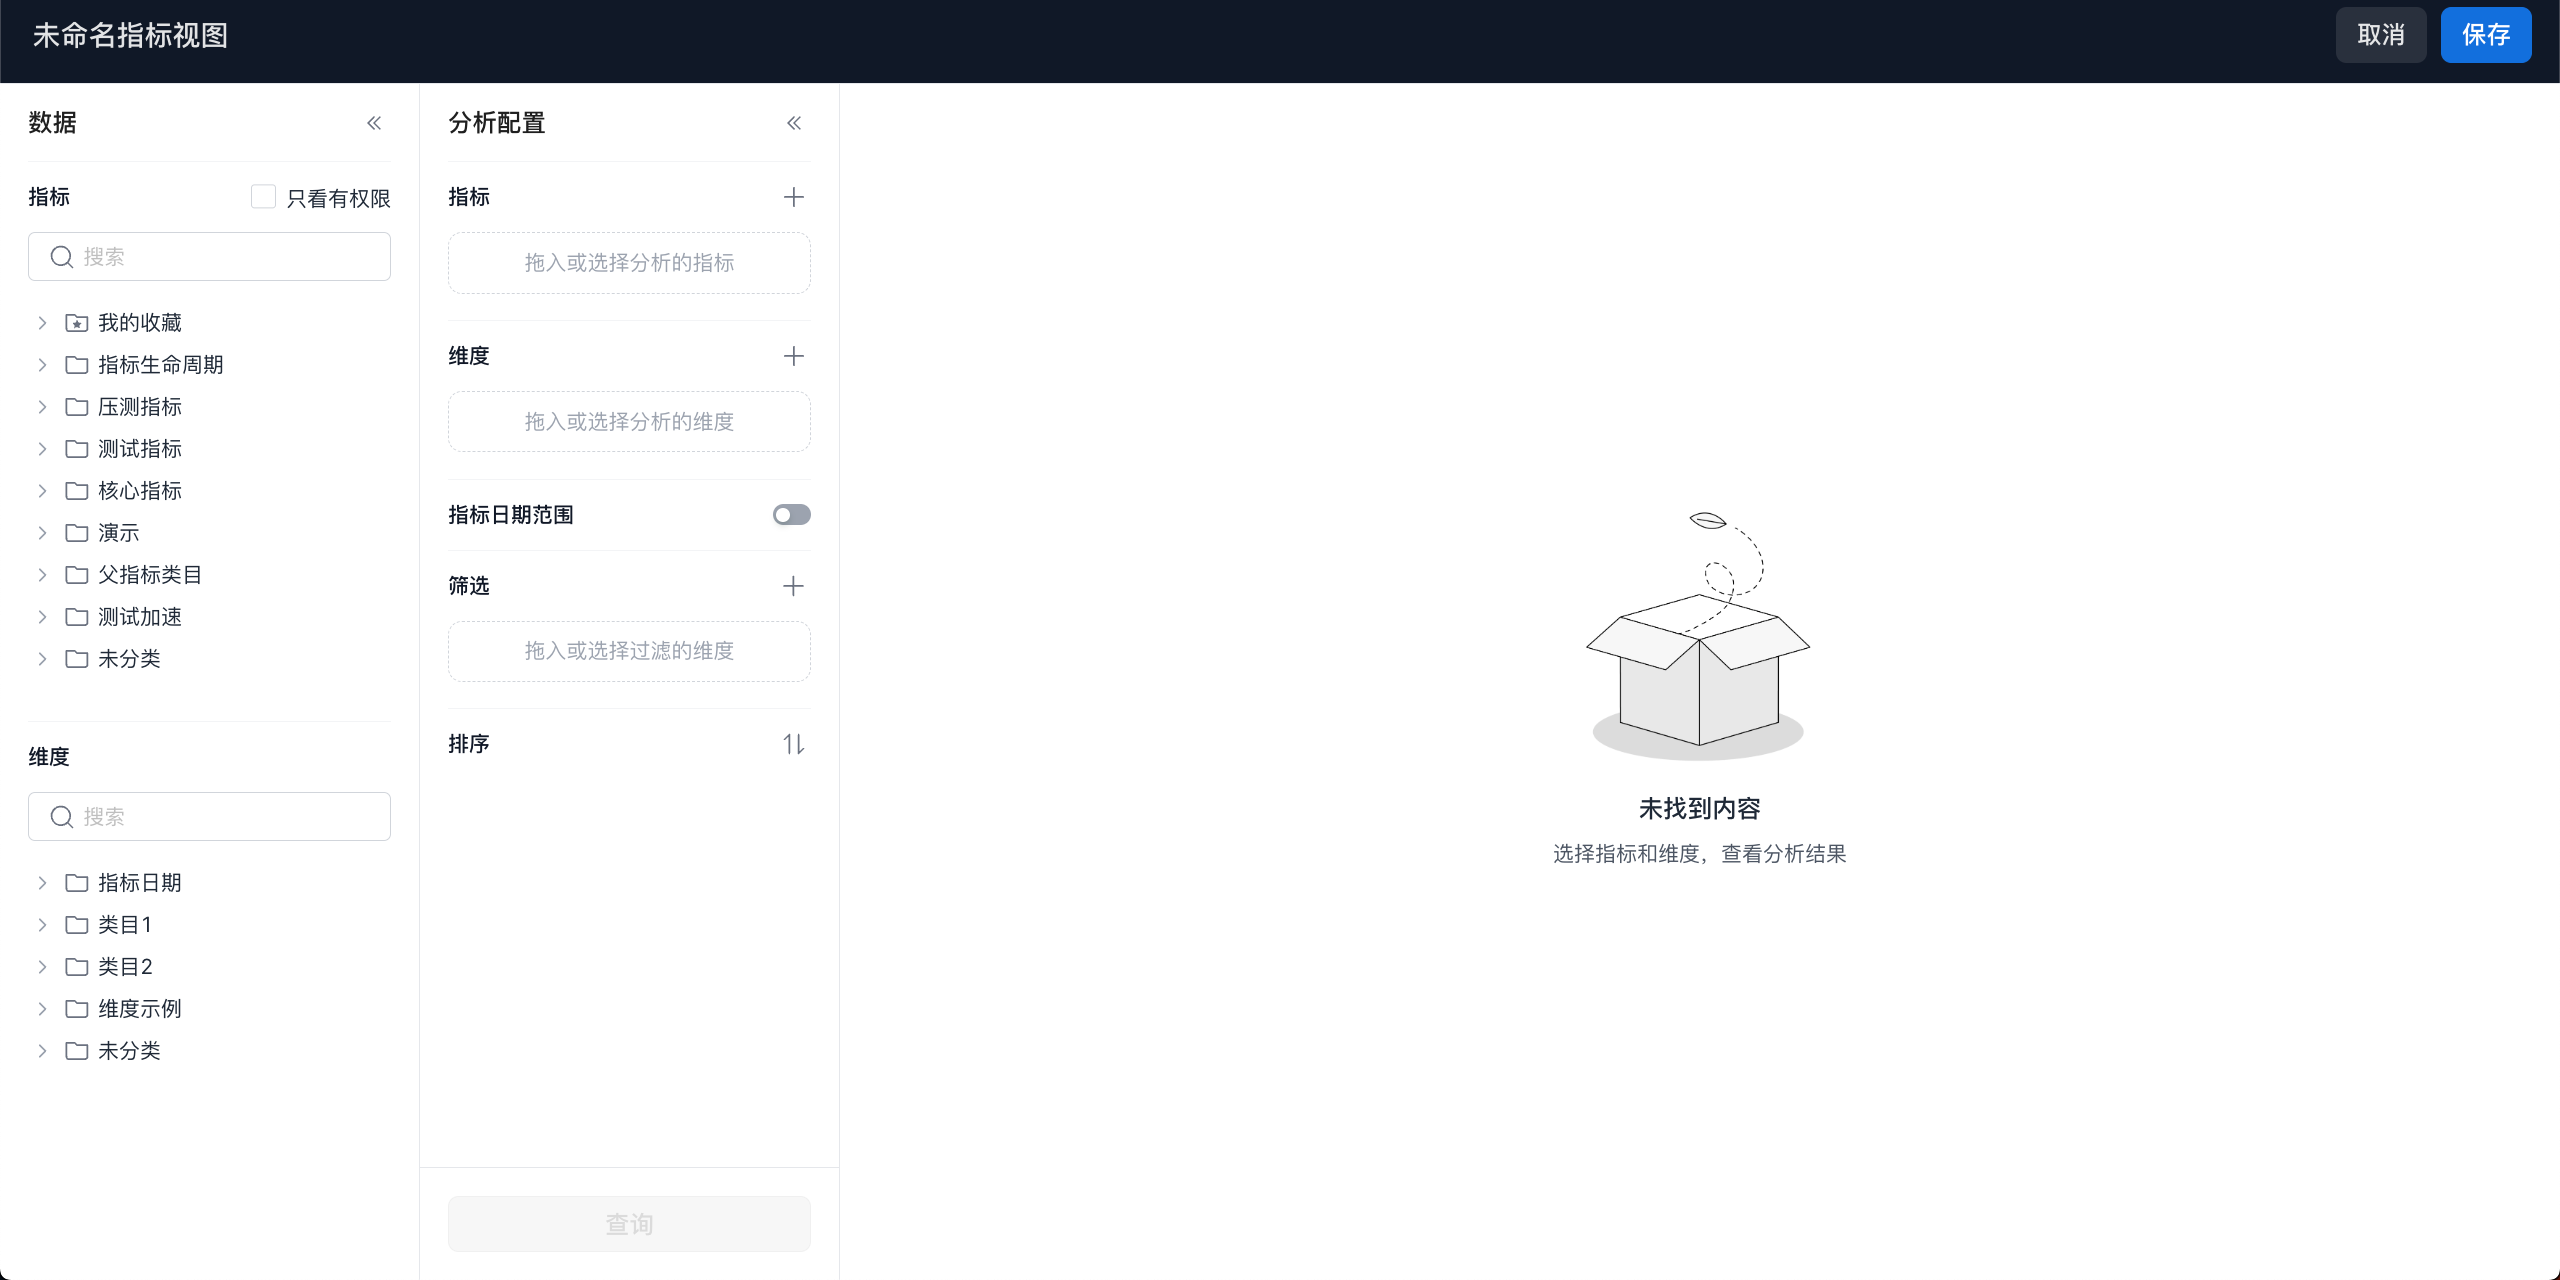
Parameter Configuration
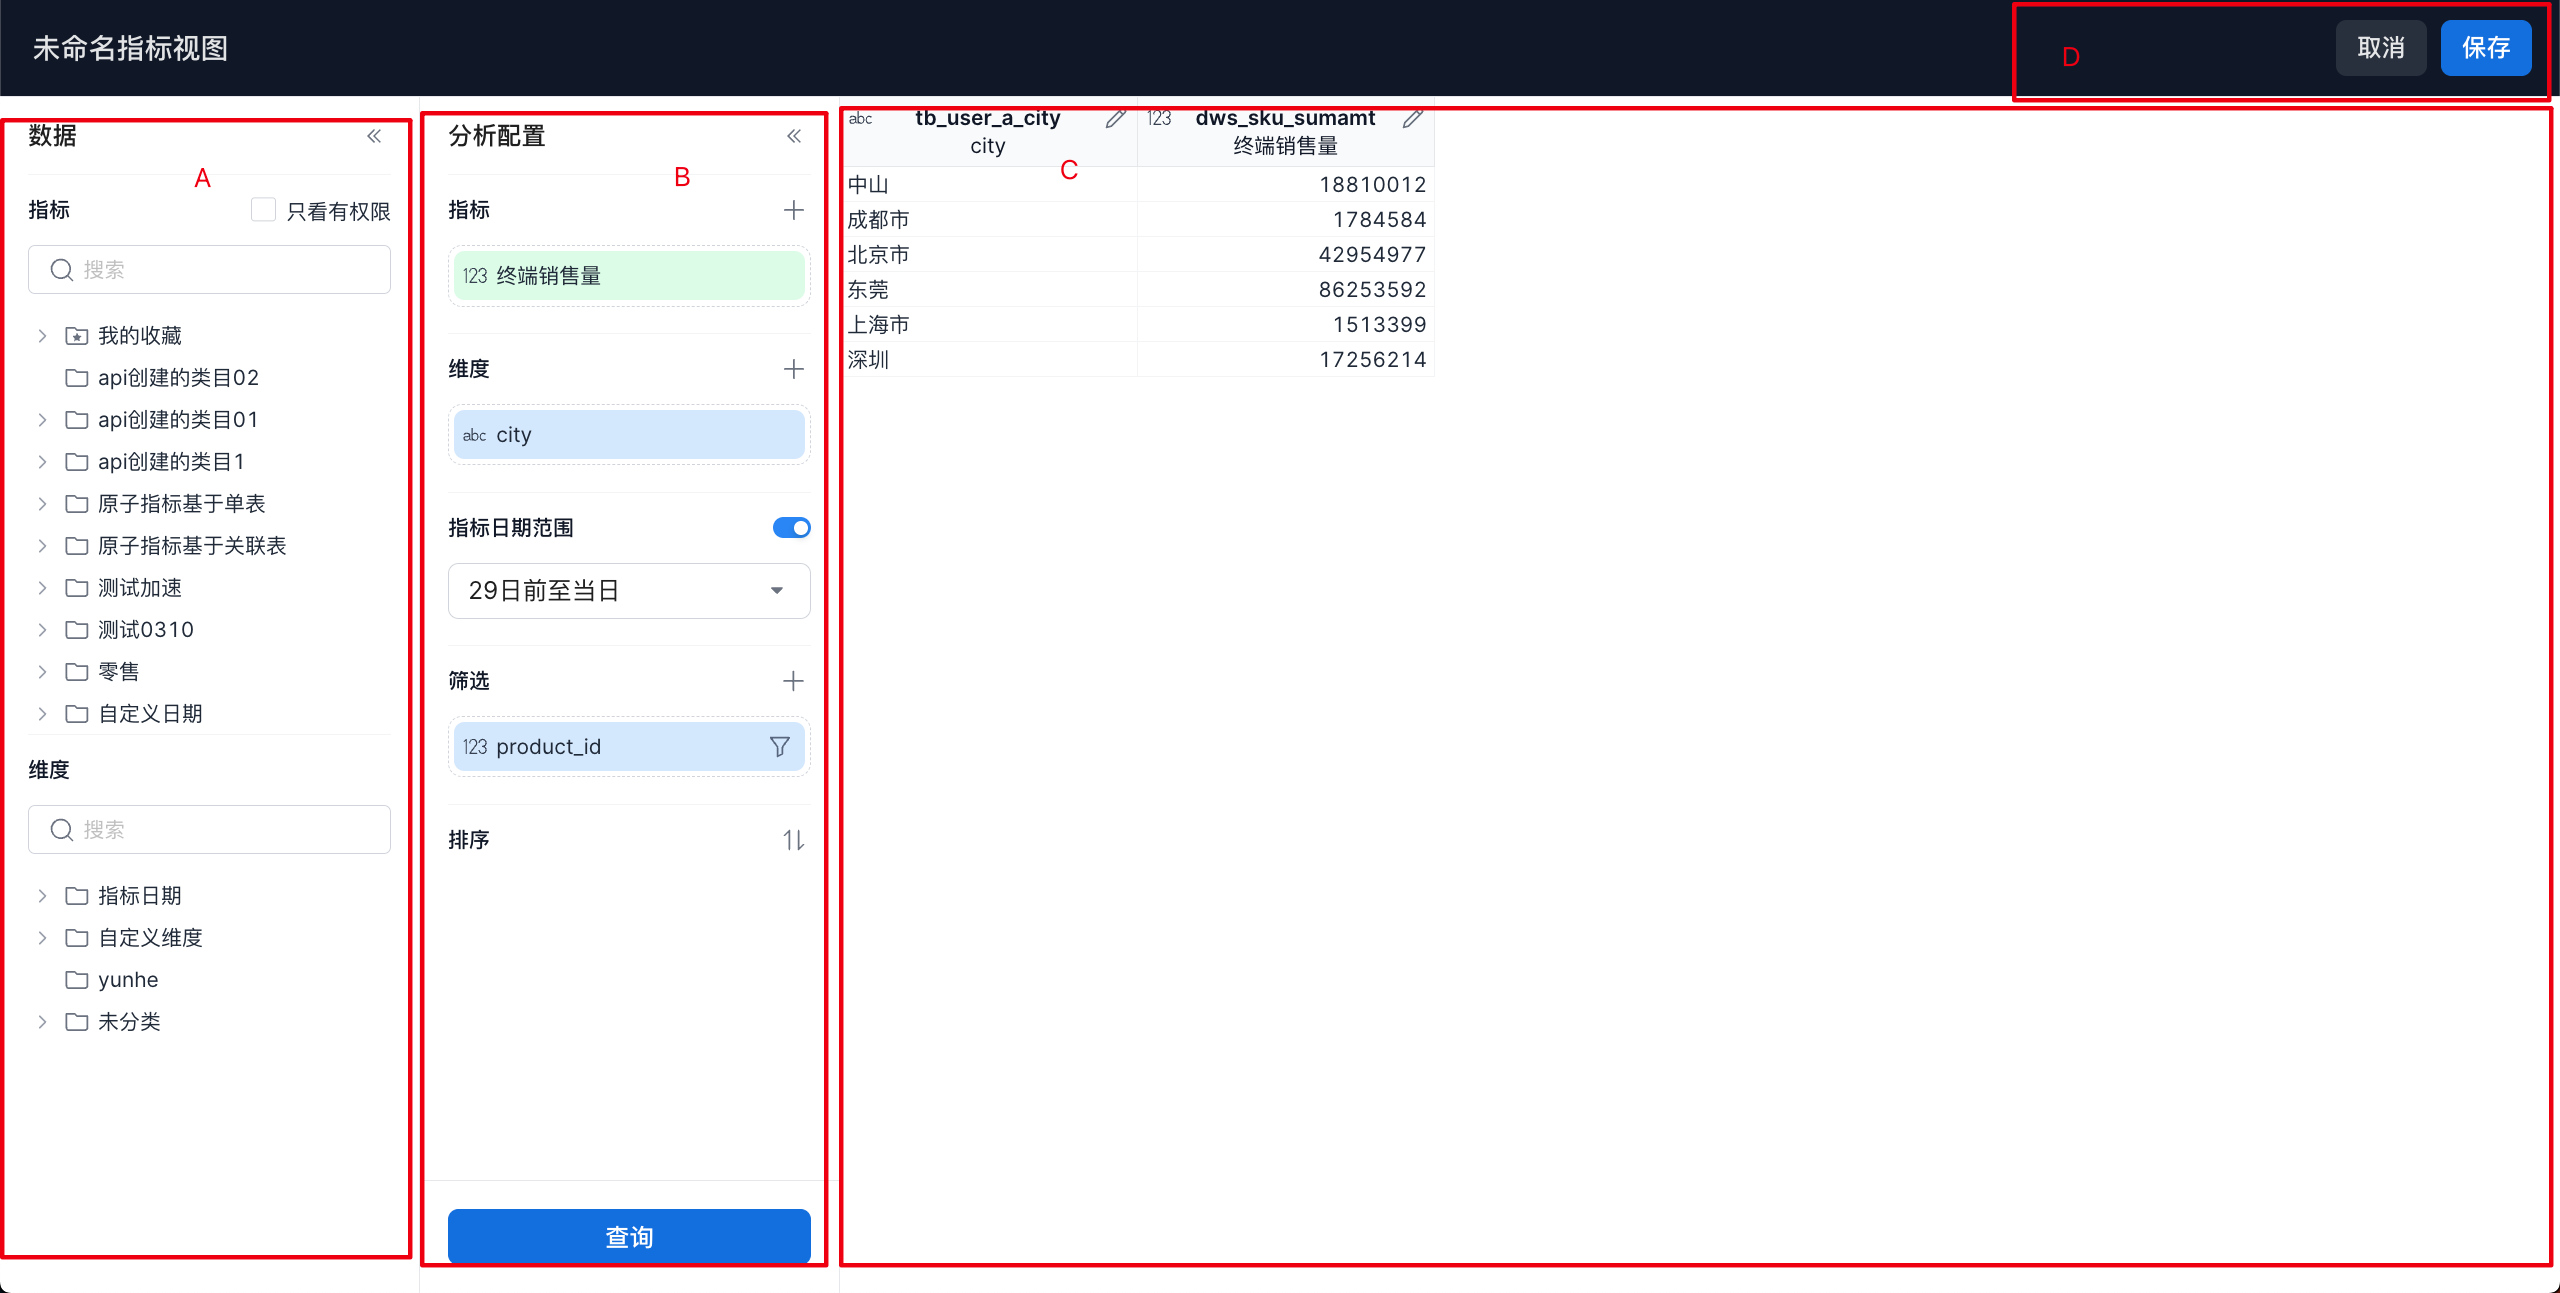
A. The data module displays all metrics and dimensions in the metric platform.
- Collapse: click the collapse button to collapse the data module.
- Show authorized only: click this option to filter out metrics that you do not have permission to use.

- Metric and dimension list: displays metrics and dimensions by the configured categories. You can drag metrics and dimensions into the corresponding analysis configuration area.
B. Analysis configuration
- Metrics
 Drag from the metric list, or click
 + and select the metric to analyze.
- Dimensions
 Drag dimensions that can be used to analyze the metric from the data list, or click
 + and select an available dimension.
- Quick filters
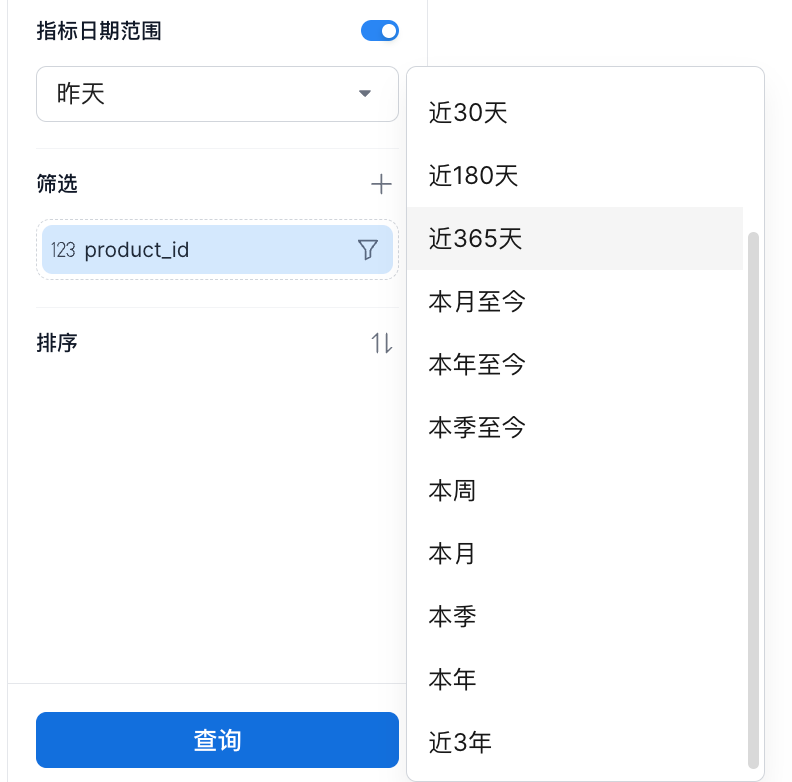 |
The system provides built-in commonly used statistical periods. Administrators can manage commonly used statistical periods in Metric Definition -> Time Limits. |
|---|---|
- Custom statistical period
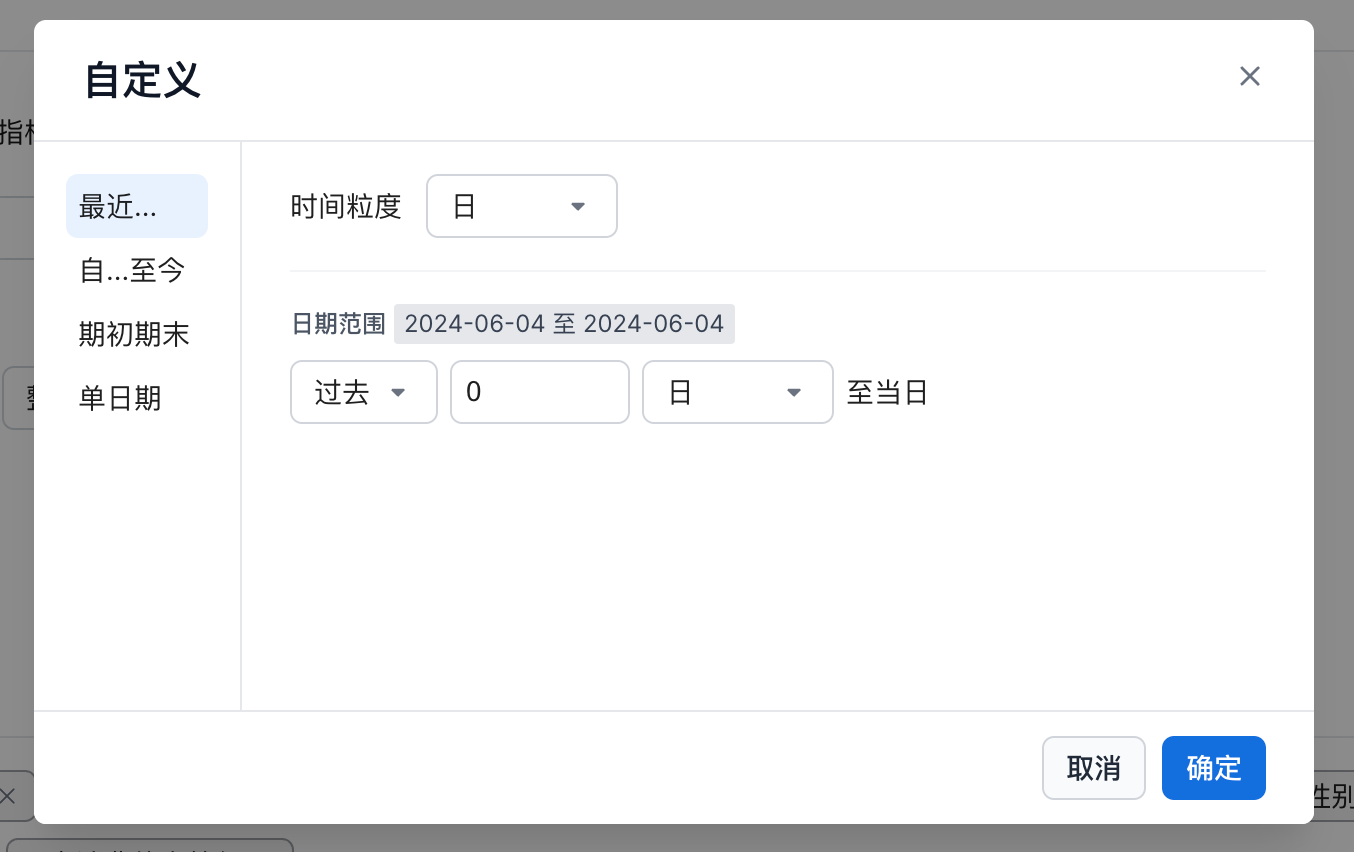 |
Define a statistical date by using the Recent... mode. This is suitable for selecting a range that offsets forward or backward from the current time. Common configurations include:- Time granularity: day - from the previous 3 days to today- Using 2024-05-20 as an example, the statistical time range is 2024-05-17~2024-05-20, for a total of 4 days.- Time granularity: day - from the previous 1 month to today- Using 2024-05-20 as an example, the statistical time range is 2024-04-20~2024-05-20.- Time granularity: month - from the next 1 year to the current month- Using 2024-05-20 as an example, the statistical time range is 2024-05~2025-05, covering complete monthly data.- Time granularity: day - from the previous 5 trading days to today- Using 2024-05-20 as an example, the statistical time range is based on 2024-05-20 and looks back 5 trading days. |
|---|---|
The selected time range is related to the selected time granularity. For example, when you view a month-granularity metric by day, the value shown for each day is the full-month value.
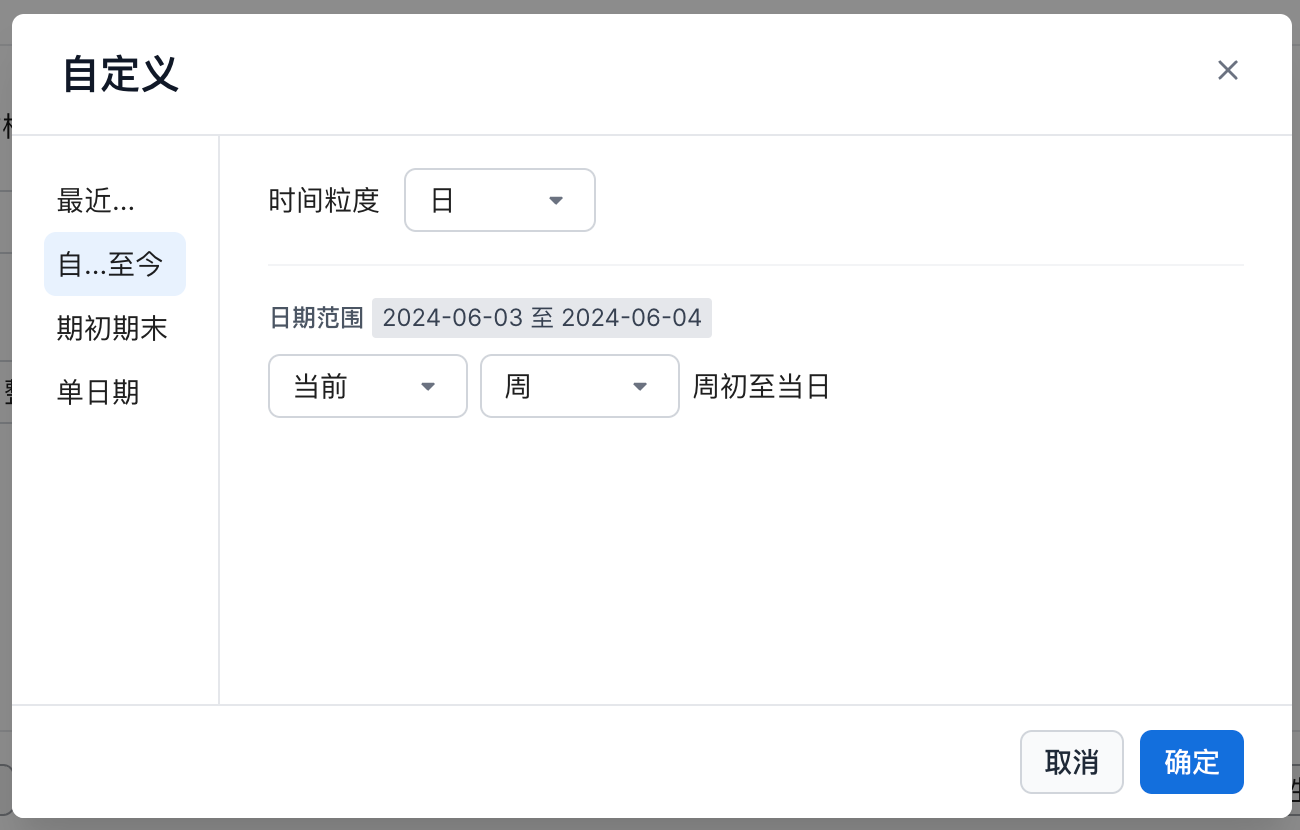 |
Define a statistical date by using the From...to present mode. This is suitable for cumulative multi-day metric results such as year-to-date or month-to-date metrics.- Time granularity: day - from the first day of the current month to today- Using 2024-05-20 as an example, the statistical time range is 2024-05-01 ~ 2024-05-20.- Time granularity: month - from the first month of the year one year ago to the current month- Using 2024-05-20 as an example, the statistical time range is 2023-01 ~ 2024-05. |
|---|---|
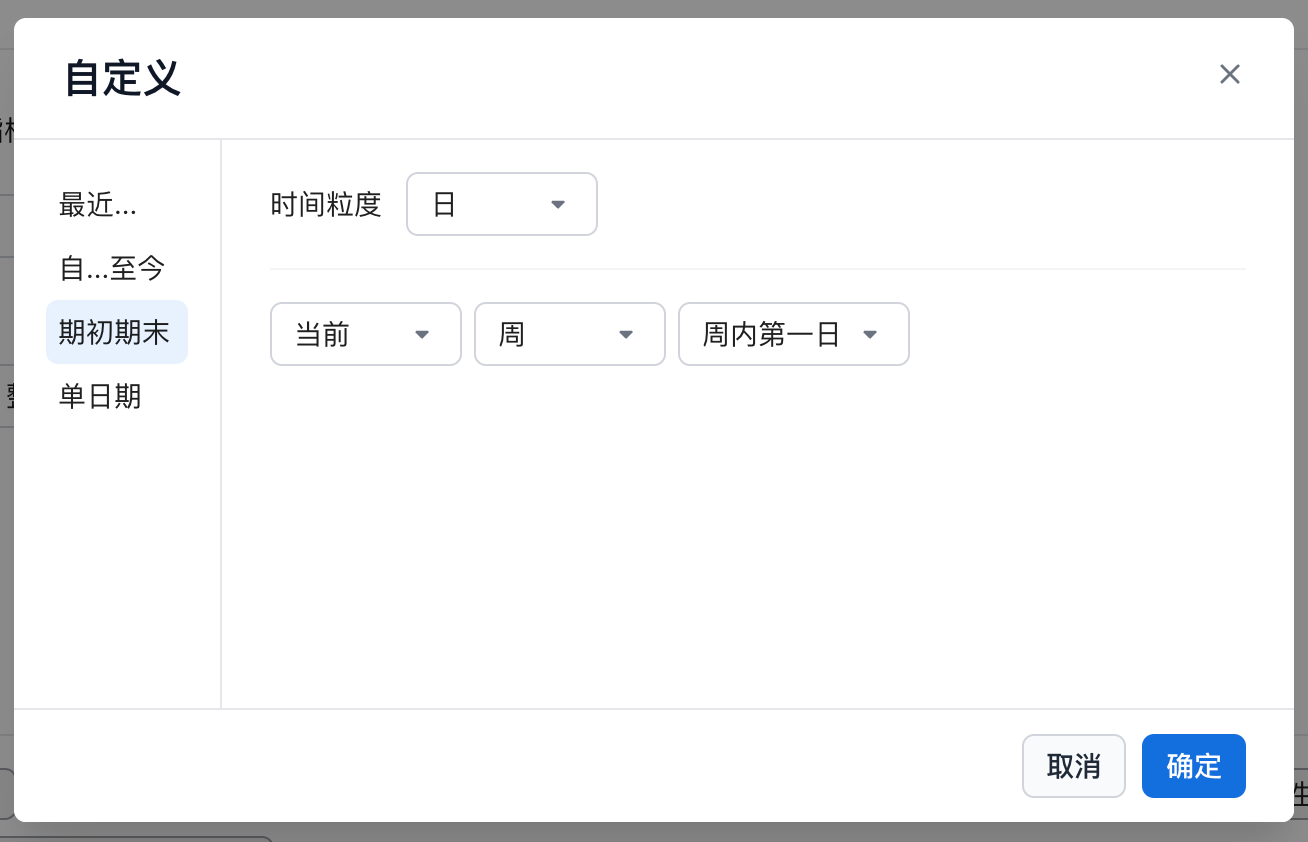 |
Define a statistical date by using the Period start/end mode. This is suitable for returning the metric value for a specific point in time.- Time granularity: day - last day of the previous month- Using 2024-05-20 as an example, the statistical time range is 2024-05-31.- Time granularity: month - first month of the current year- Using 2024-05-20 as an example, the statistical time range is 2024-01. |
|---|---|
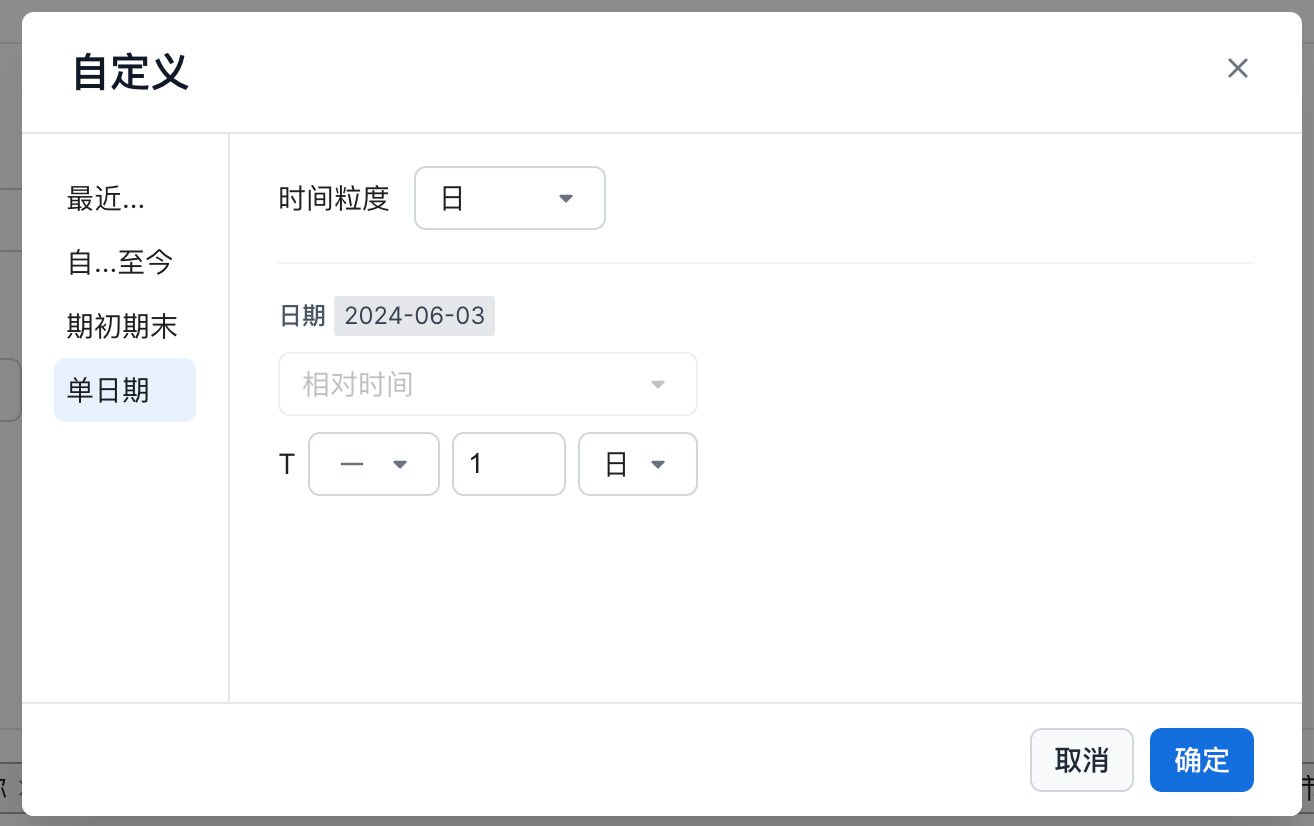 |
Define a statistical date by using the single-date mode. This is suitable for viewing a specific time such as last month or yesterday. - Time granularity: day - T-1 day- Using 2024-05-20 as an example, the statistical time range is 2024-05-19.- Time granularity: day - T-1 month- Using 2024-05-20 as an example, the statistical time range is 2024-04-20.- Time granularity: month - T-1 year- Using 2024-05-20 as an example, the statistical time range is 2023-05. |
|---|---|
- Filters
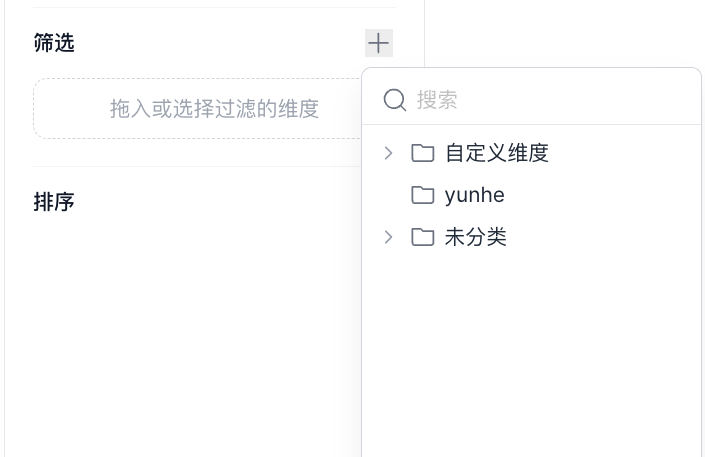 |
- Drag - Drag a dimension from the data dimension list into the filter box. - Select - Click the + button and select a dimension under the specified category in the pop-up window. |
|---|---|
- Sorting
 |
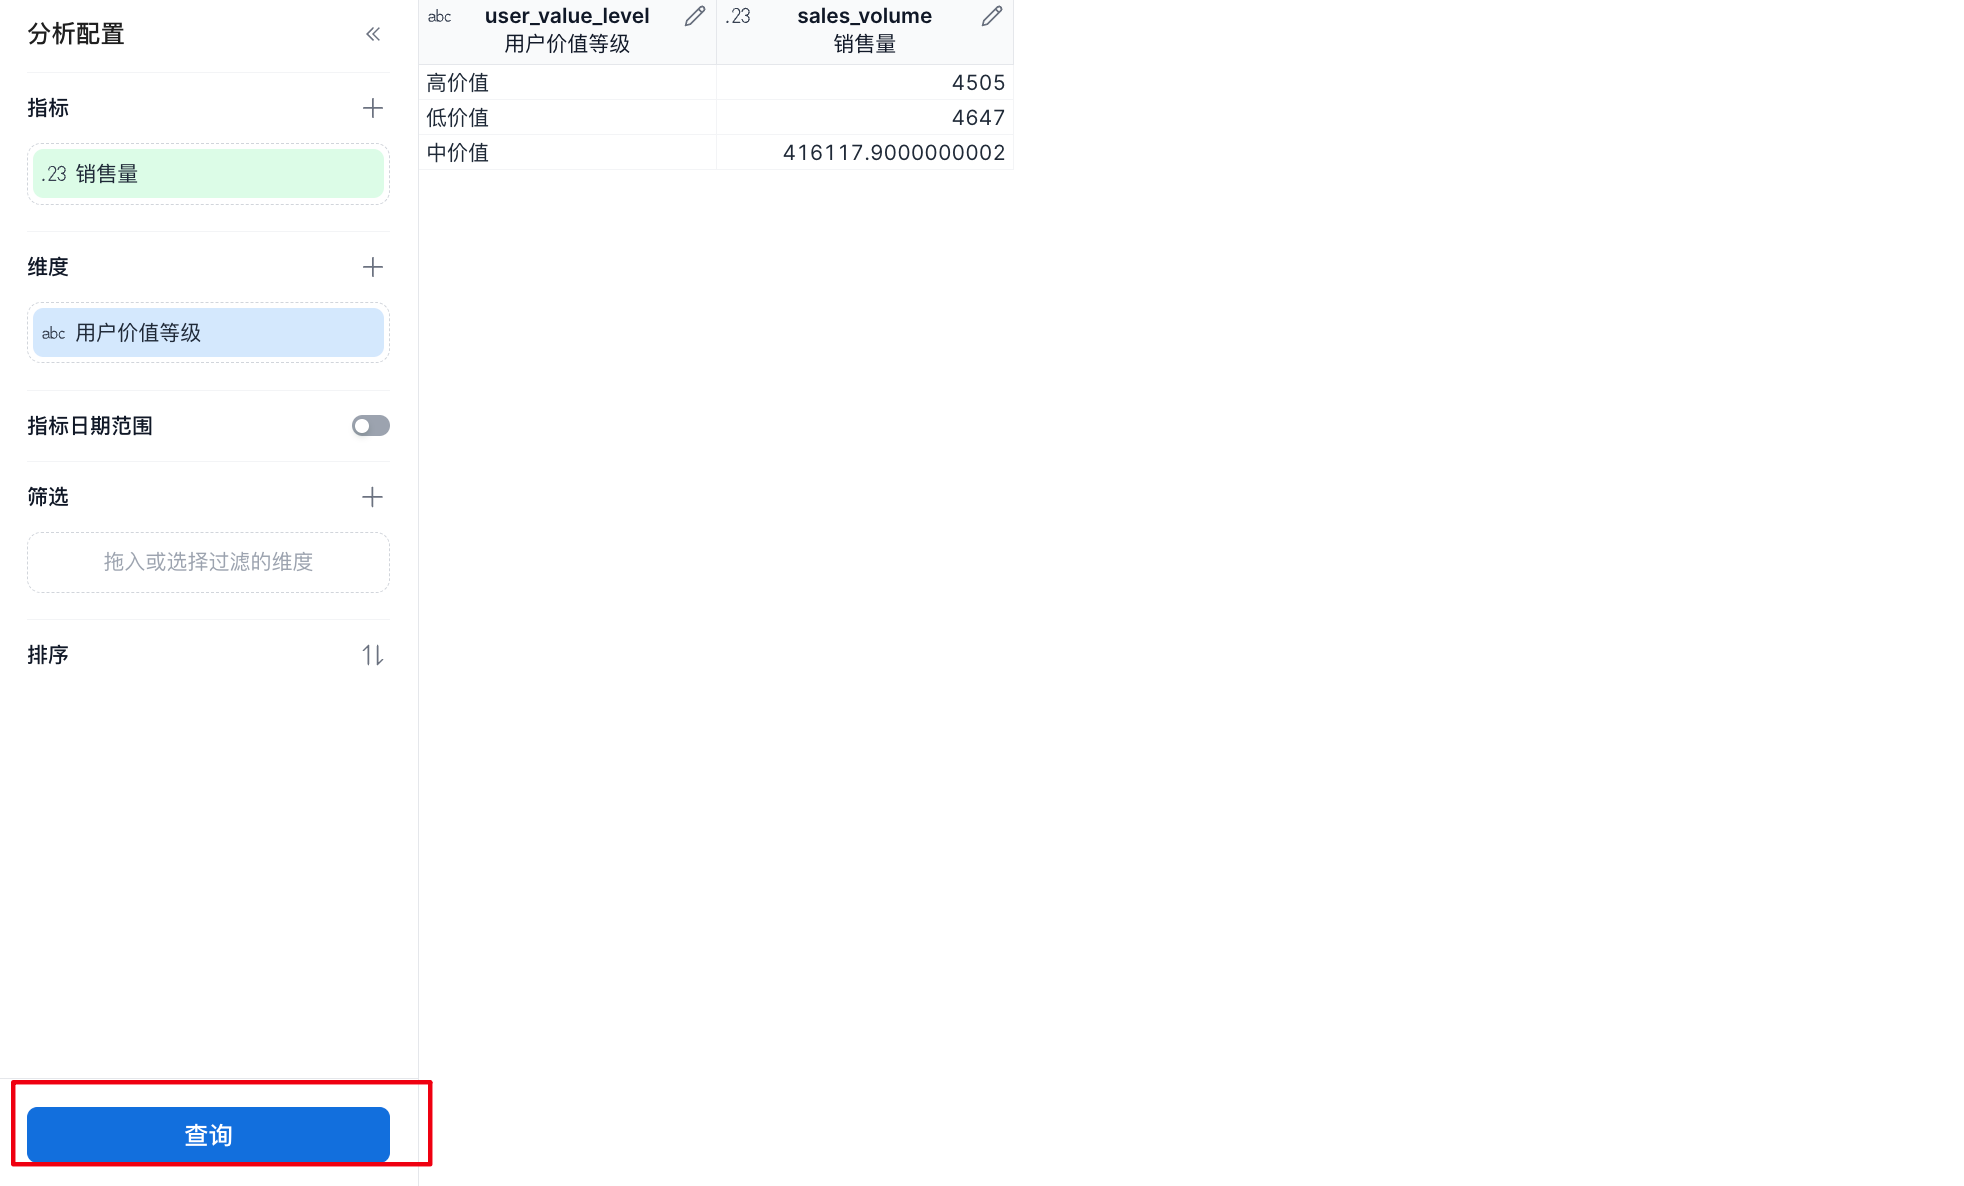
- Select a sorting dimension or metric. Use + Add Dimension/Metric to add a selected dimension or metric from the metric view. |
|---|---|
 |
- Adjust the sort priority in the sorting list. - In the example above, priority is applied from top to bottom. This is similar to ORDER BY 'user value tier', 'sales volume' asc/desc in SQL.- Hover over the :: button to drag a dimension or metric to a different position. |
|---|---|
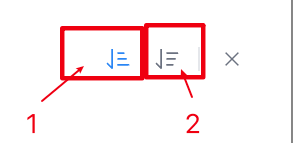 |
- Sort direction - 1 indicates ascending order. - 2 indicates descending order. |
|---|---|
C. Data preview
 |
- Data result preview - Click the query button to preview the data results on the right. |
|---|---|
D. Metric view actions
 |
- Metric view actions: - Cancel: discard the current metric view edits. - Save: save the current metric view. |
|---|---|
Quick Metric Derivation
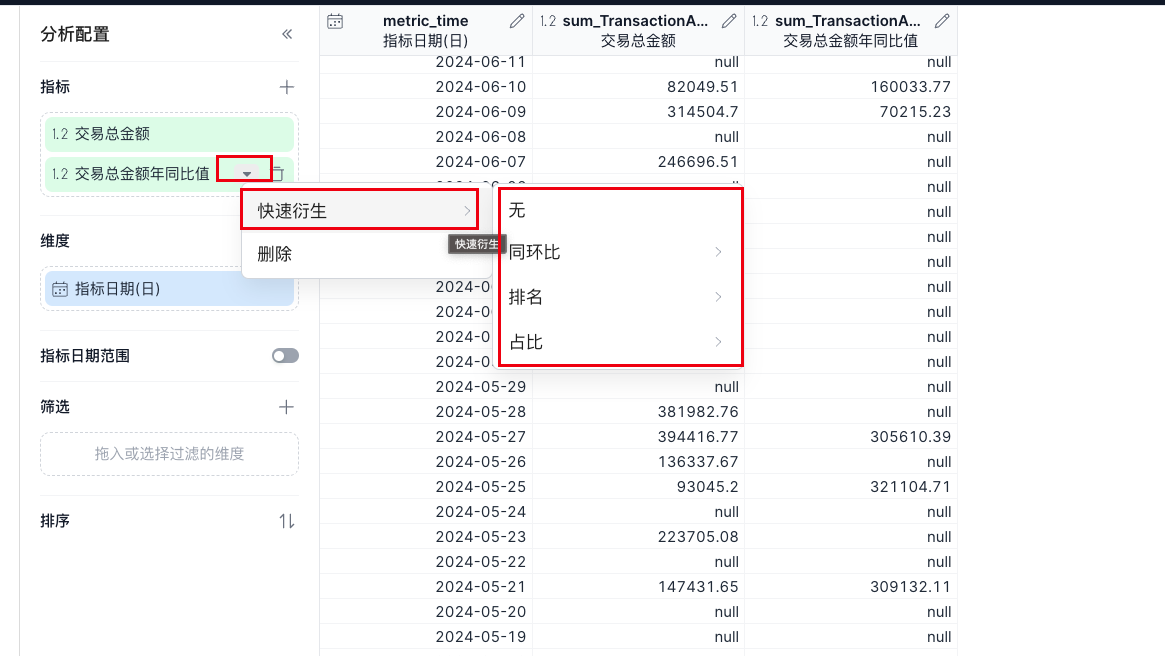
Metric views provide quick metric derivation. You can quickly derive period-over-period comparisons, rankings, and percentage-of-total calculations by clicking the drop-down button for a metric.