5-Minute Quick Start
Overview
This tutorial walks you through the full flow from importing data to defining and analyzing metrics.
Steps
Step 1: Import Data
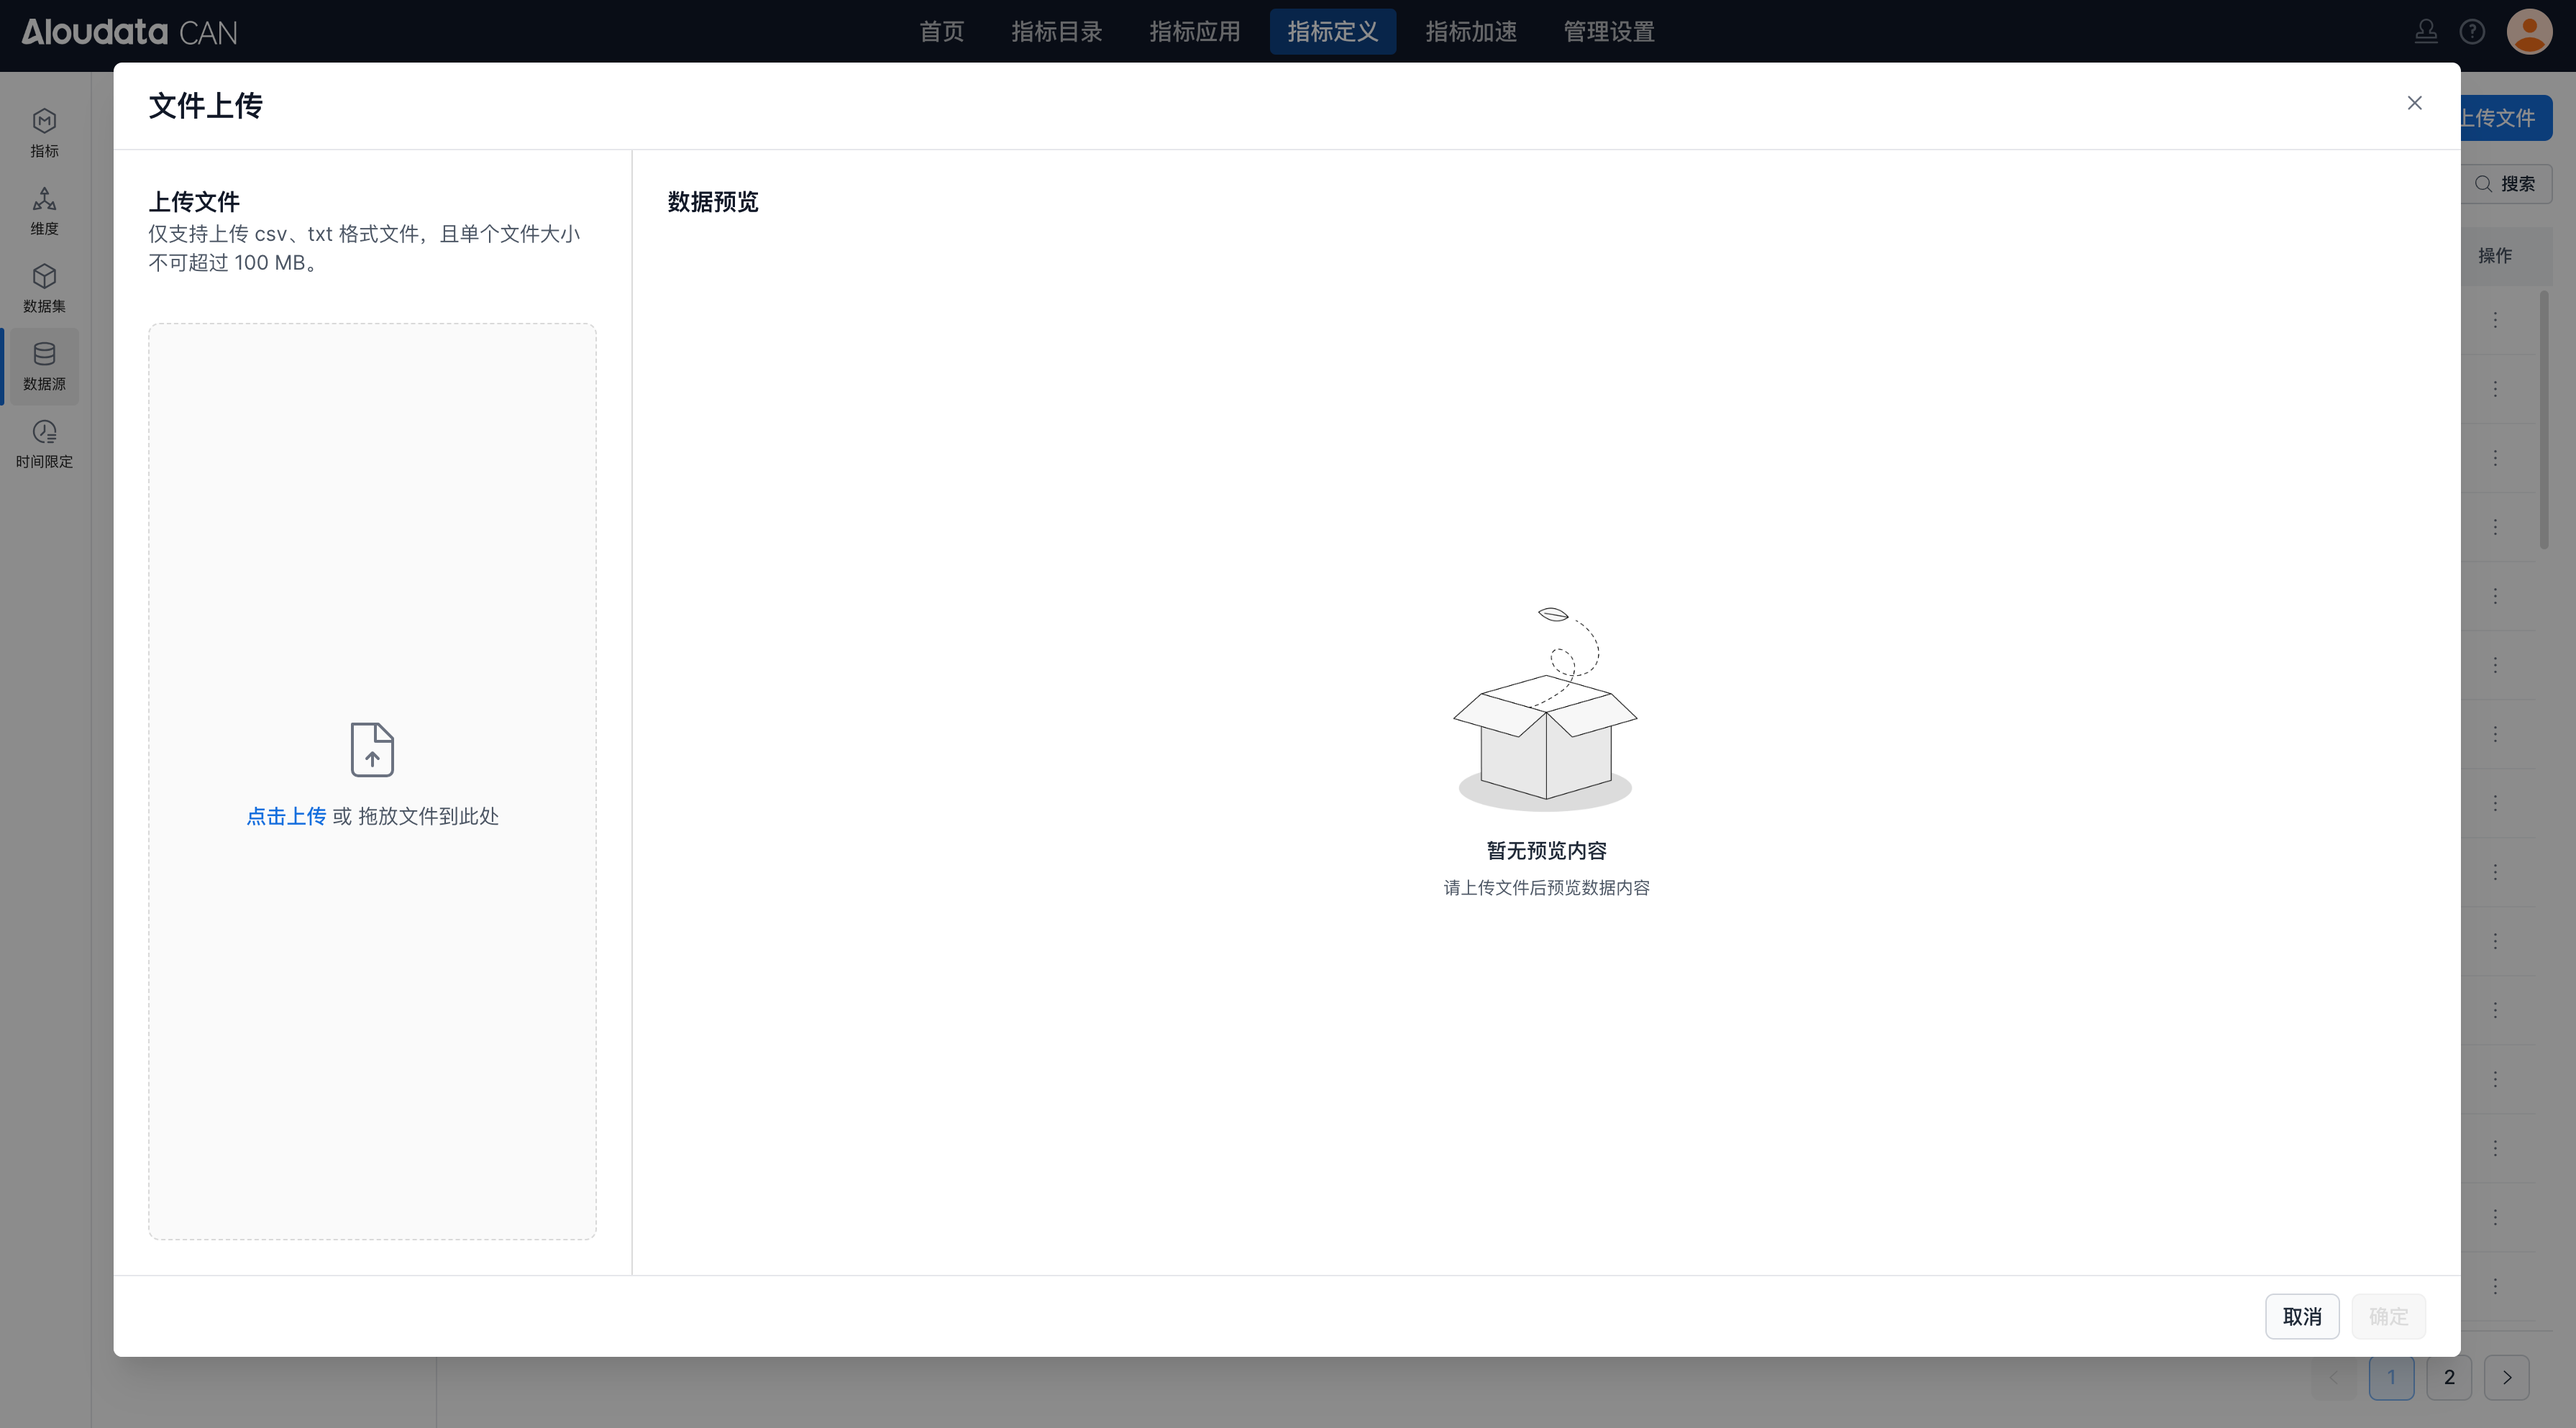
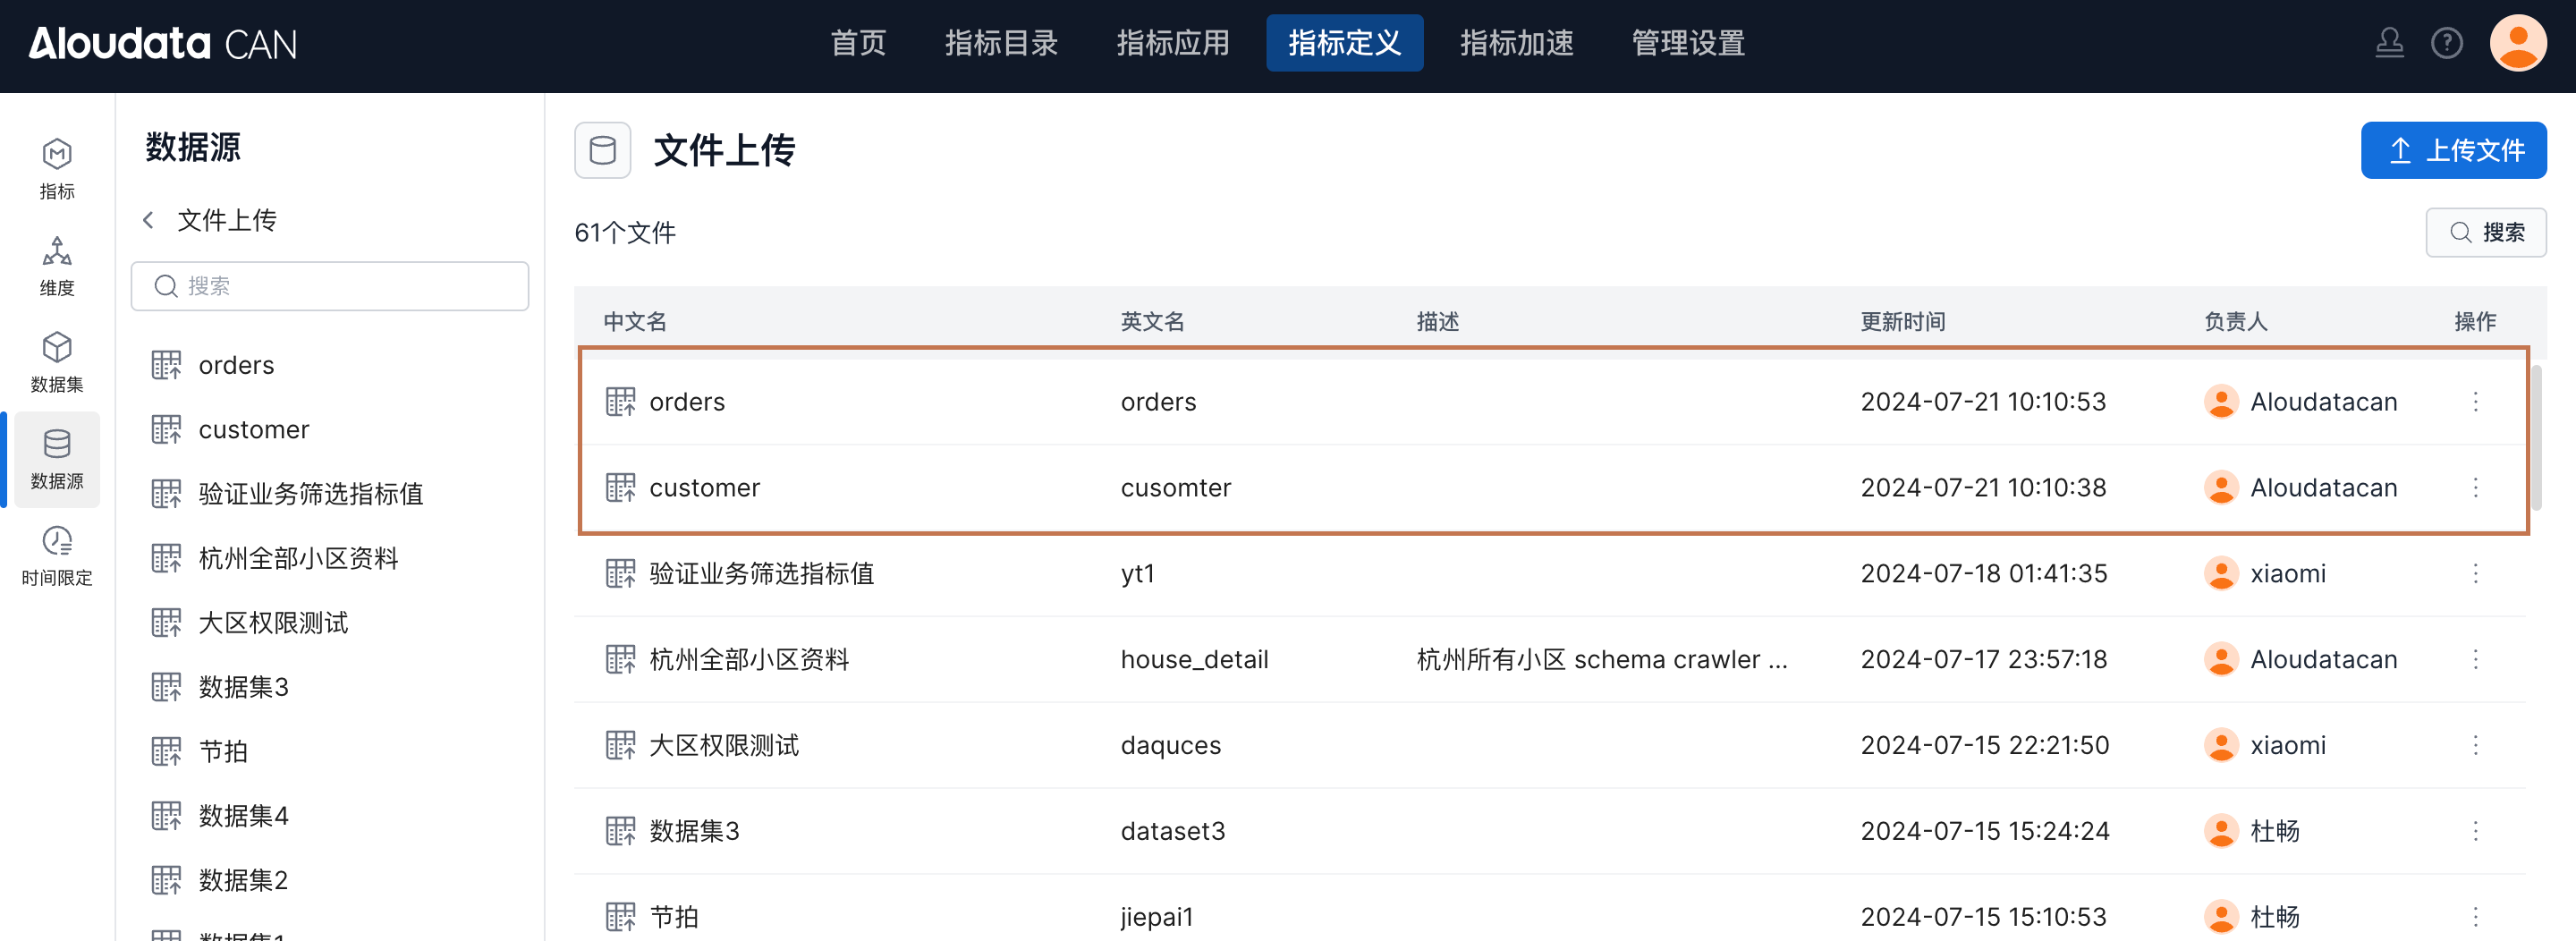
Click Metric Definition -> File Upload.
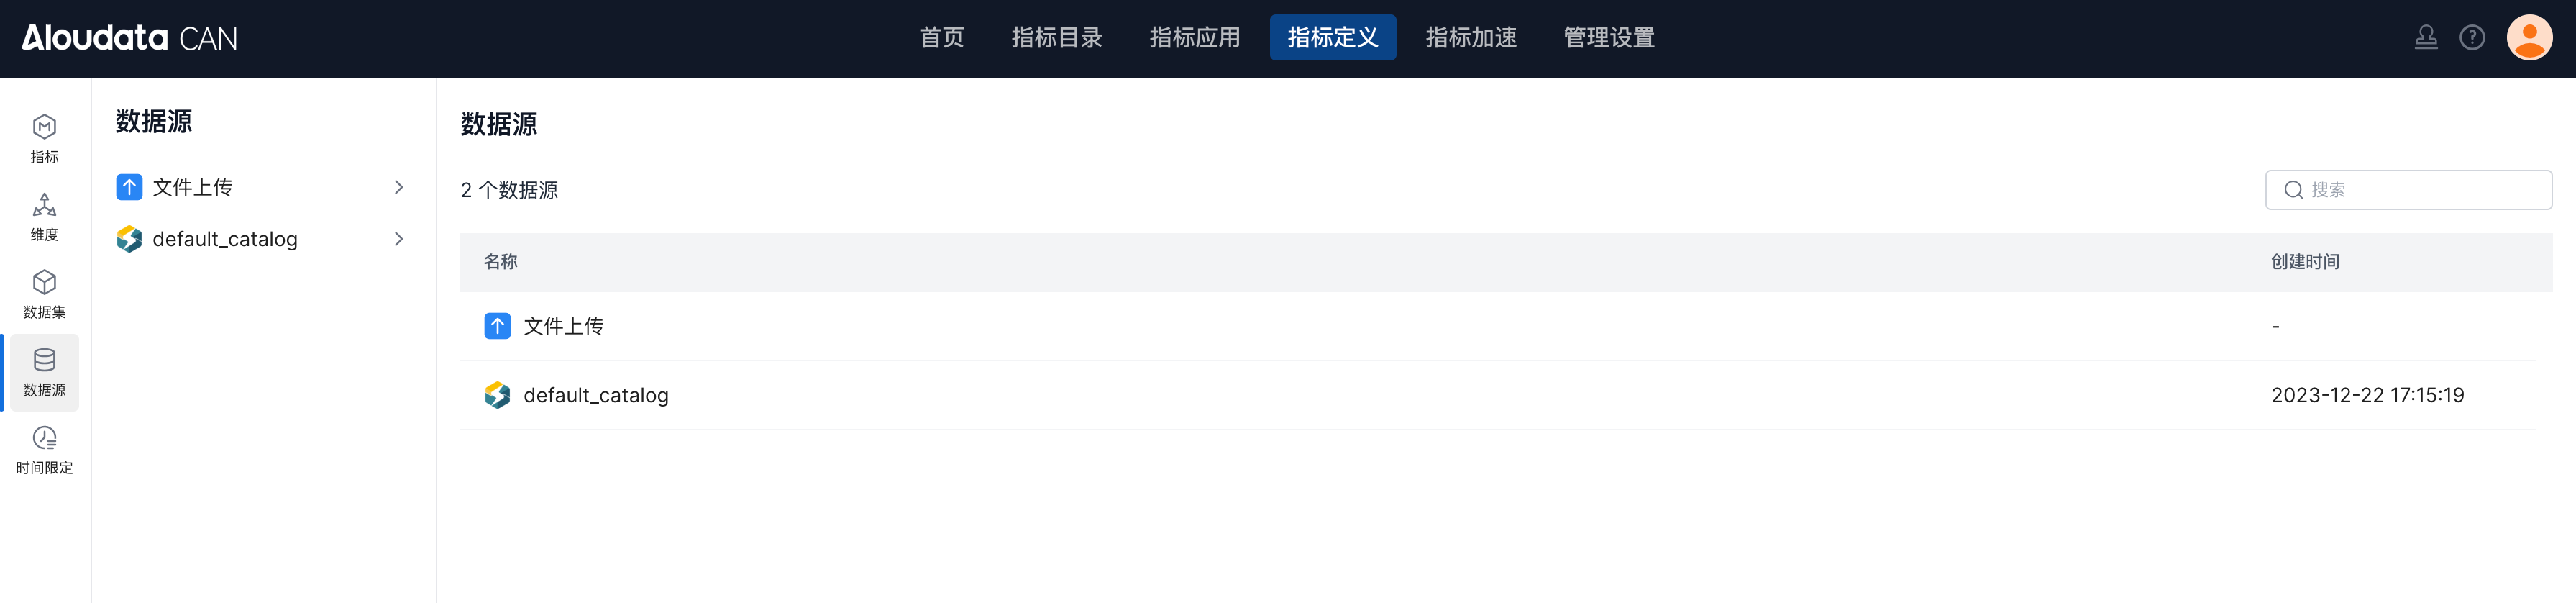
Upload the demo data files to your environment.
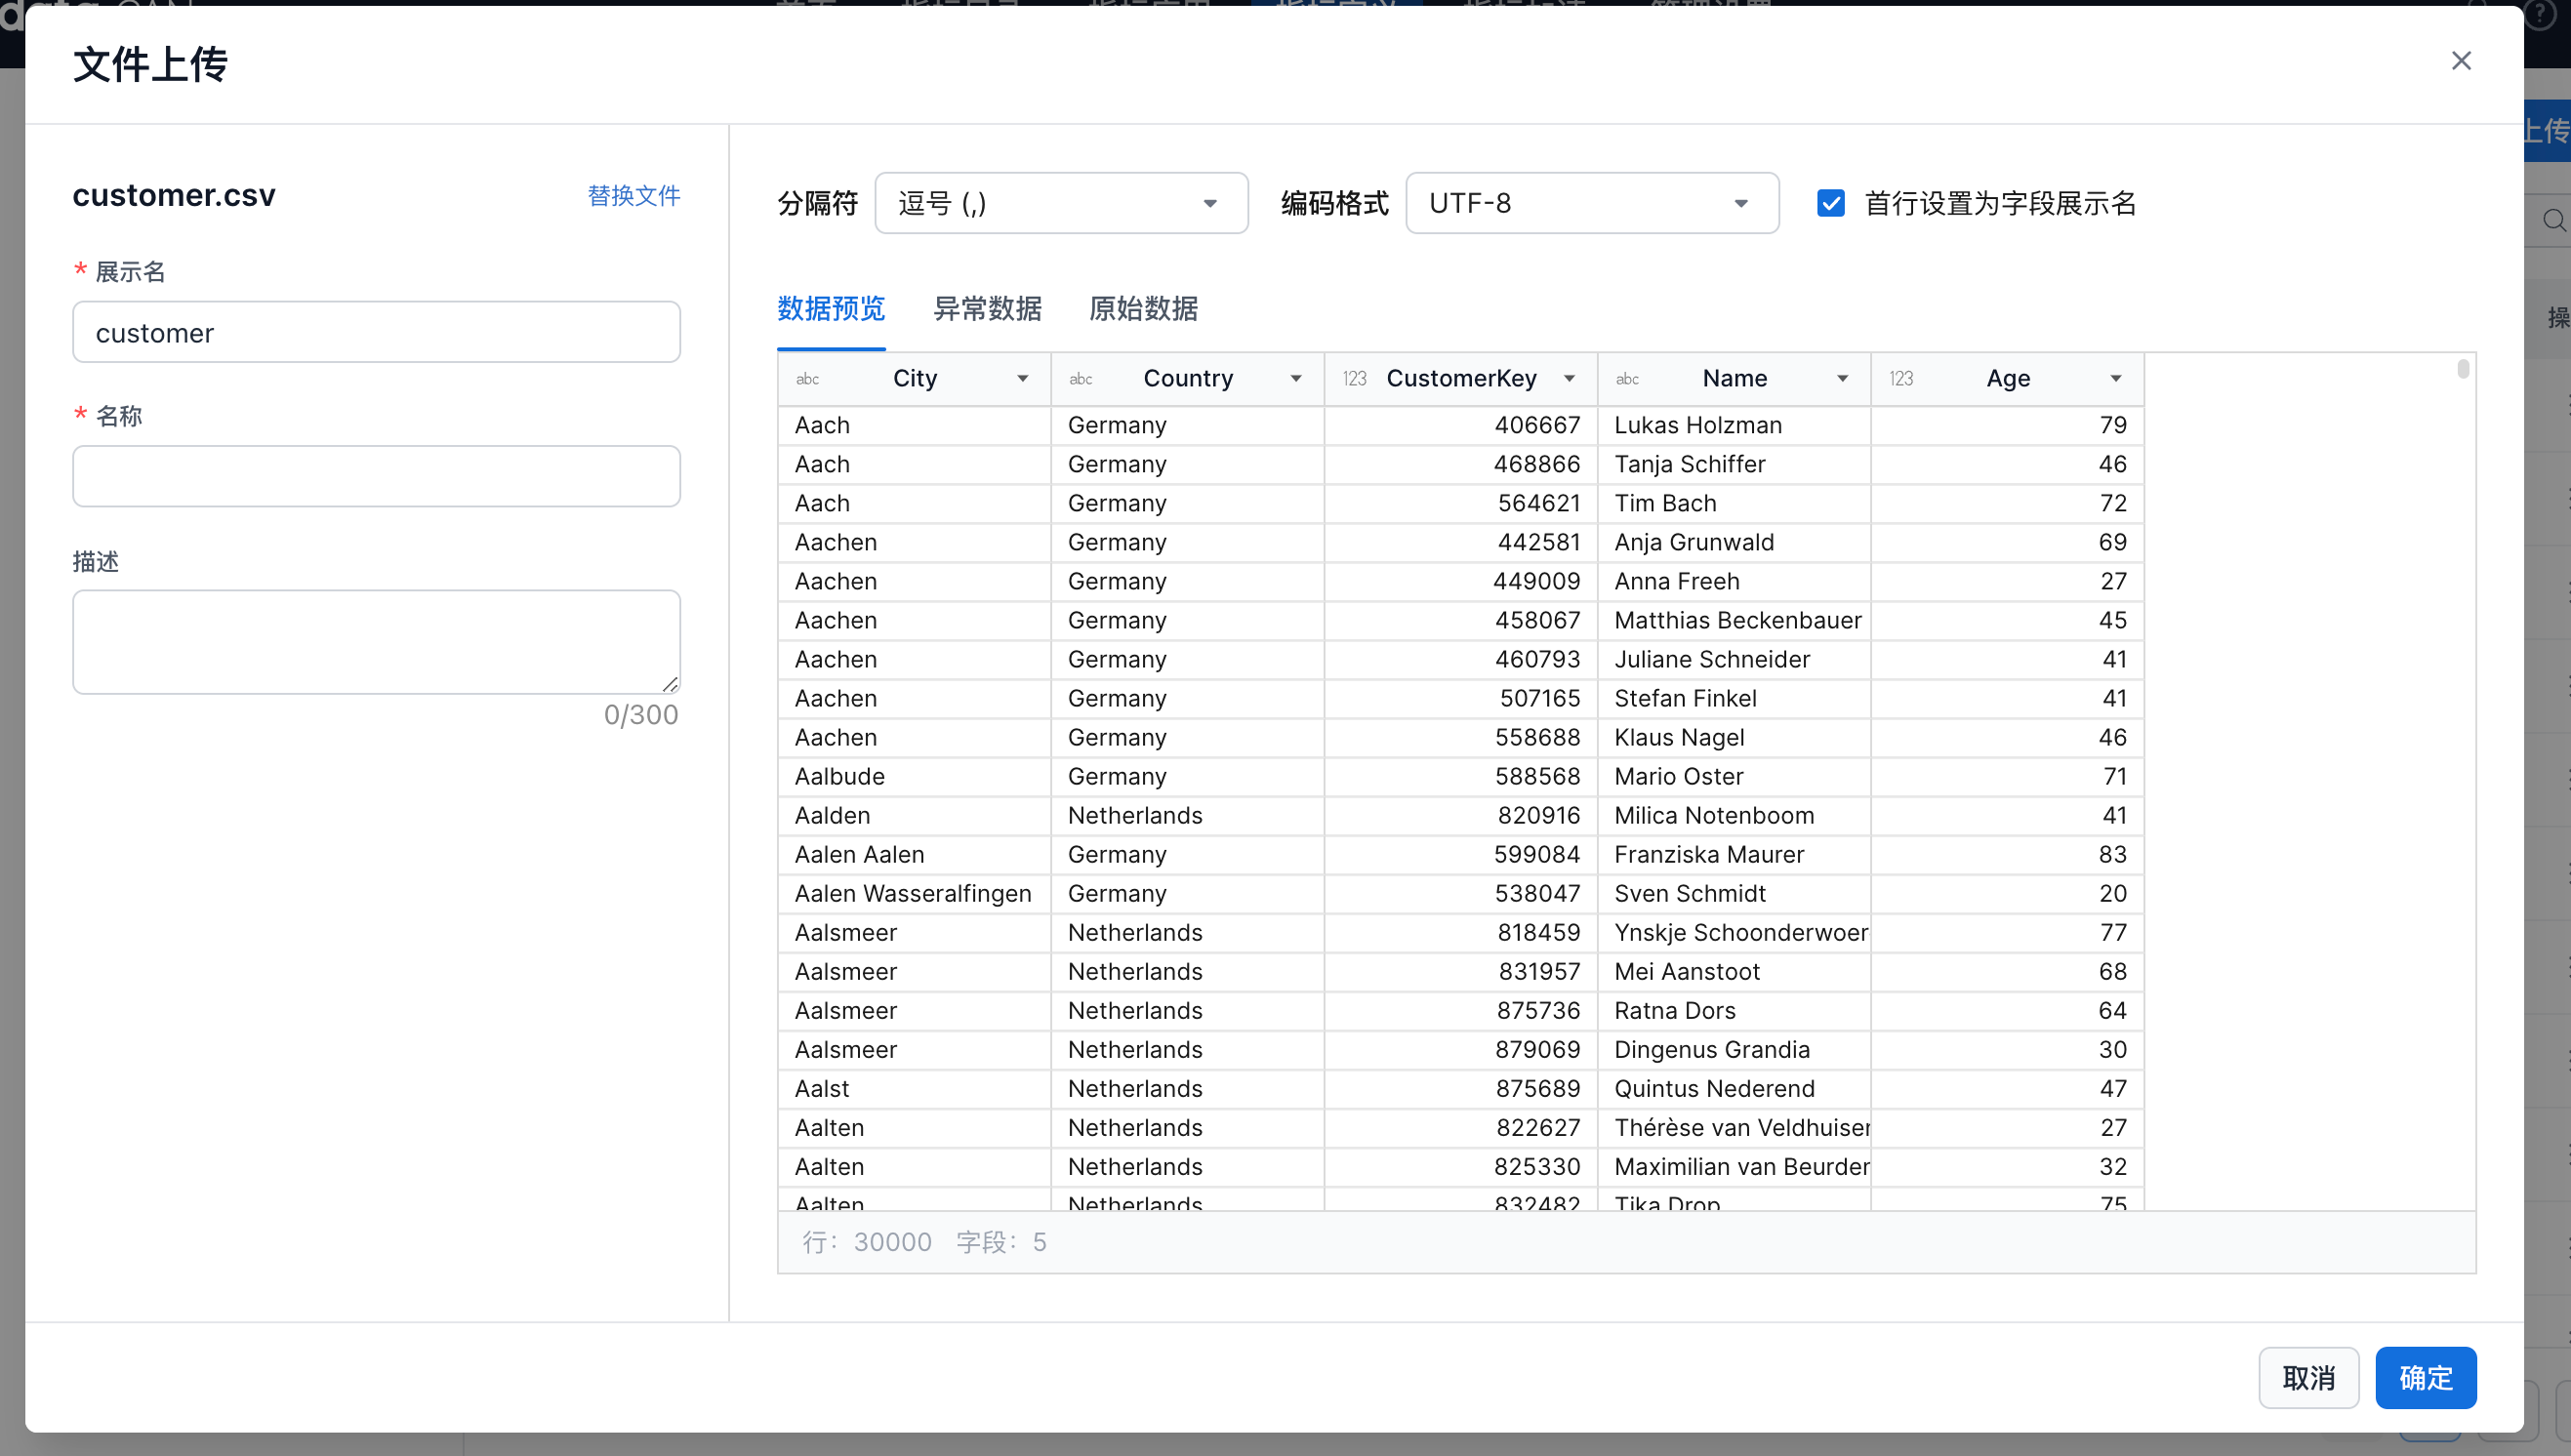
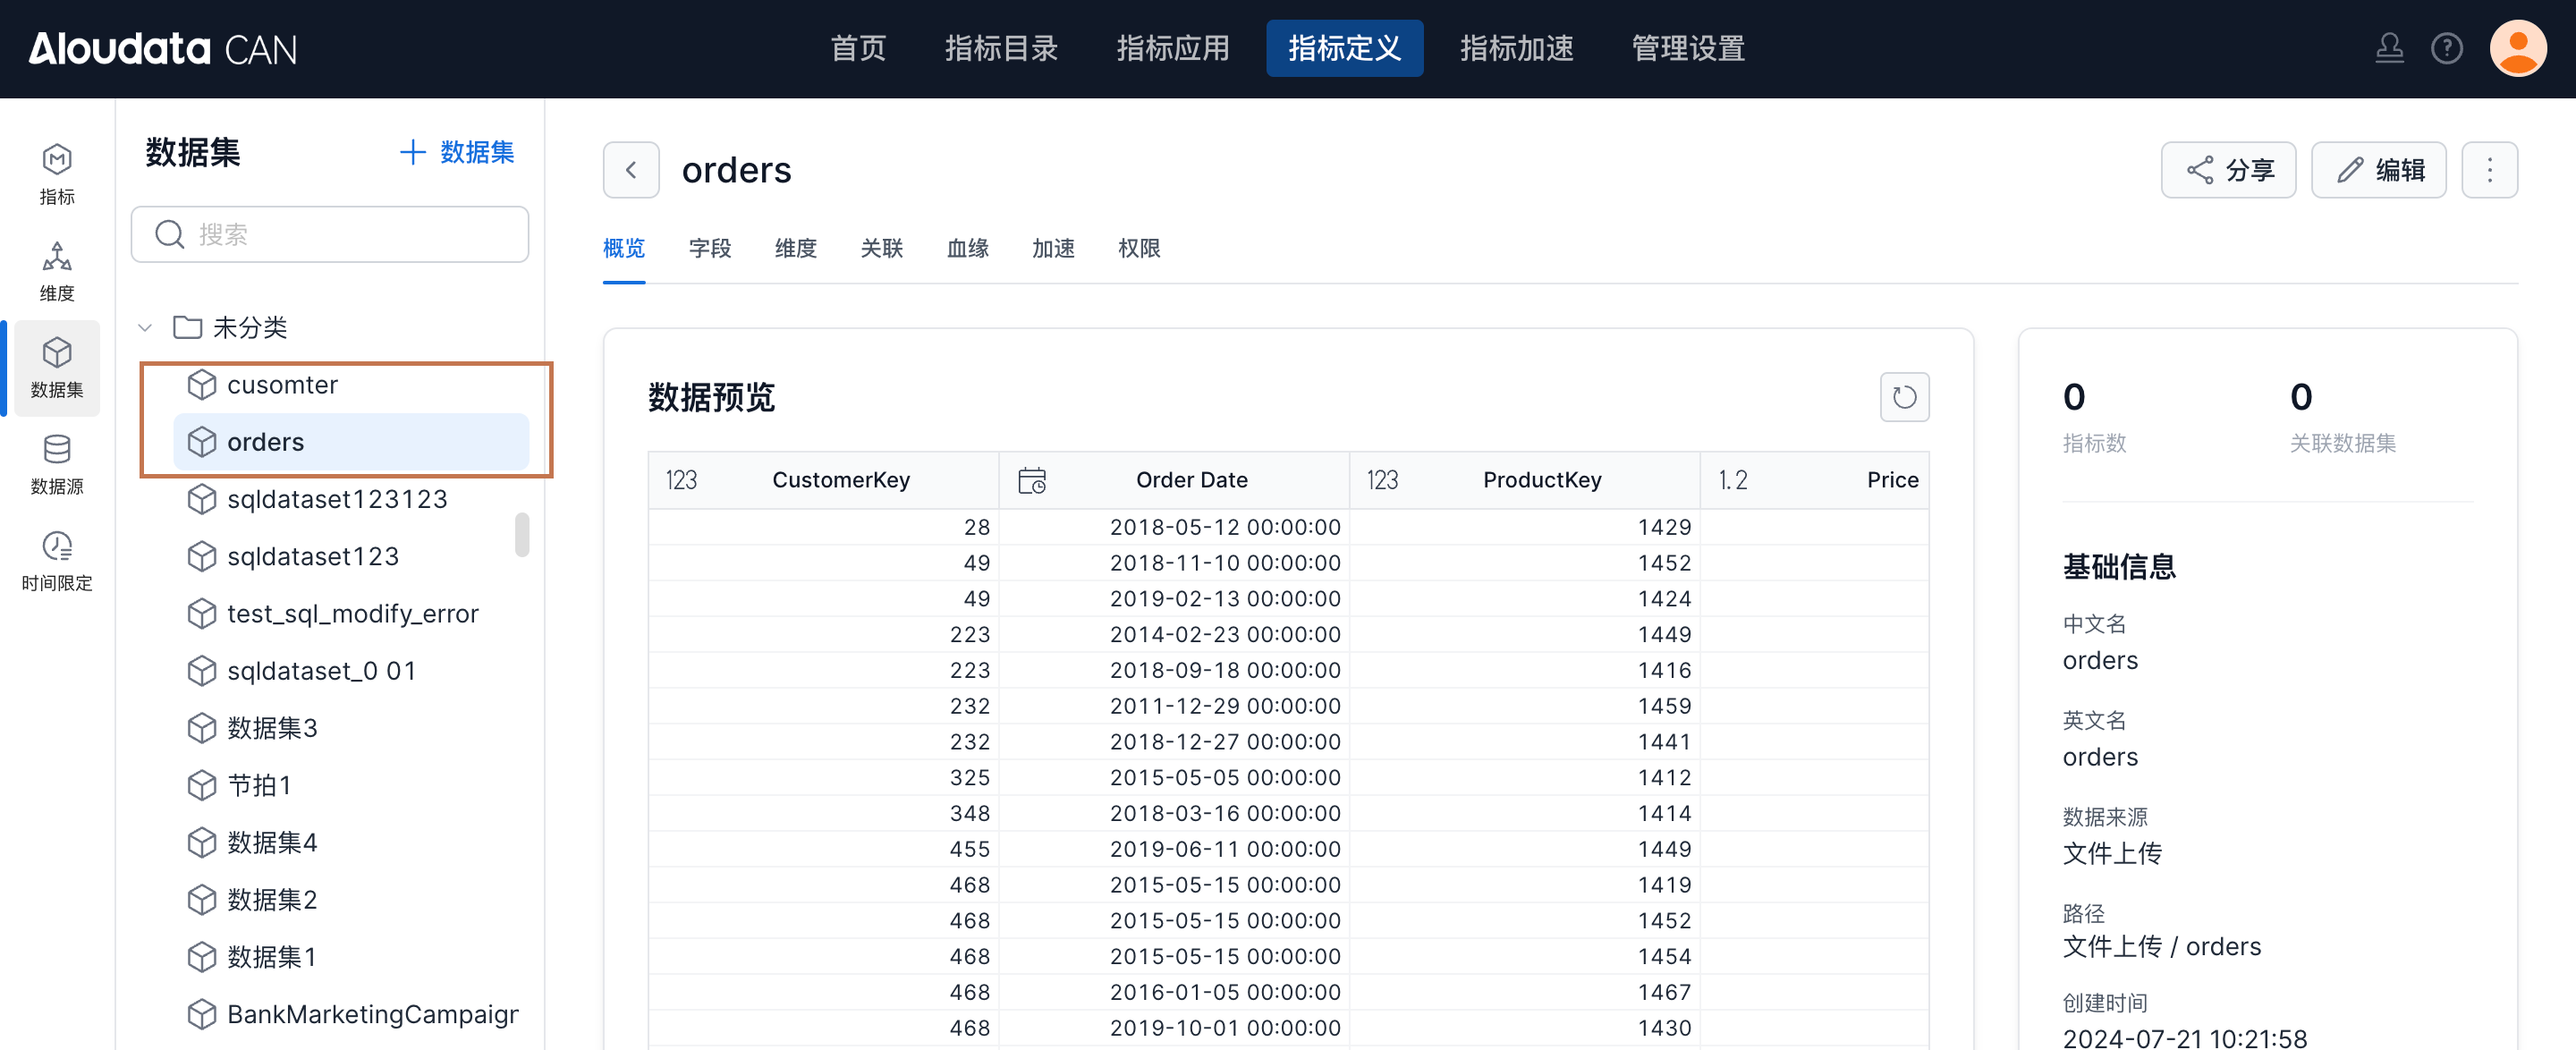
After the upload is complete, two tables appear under Data Source / File Upload.
Step 2: Create Datasets
Click Metric Definition -> Dataset -> Create Dataset.
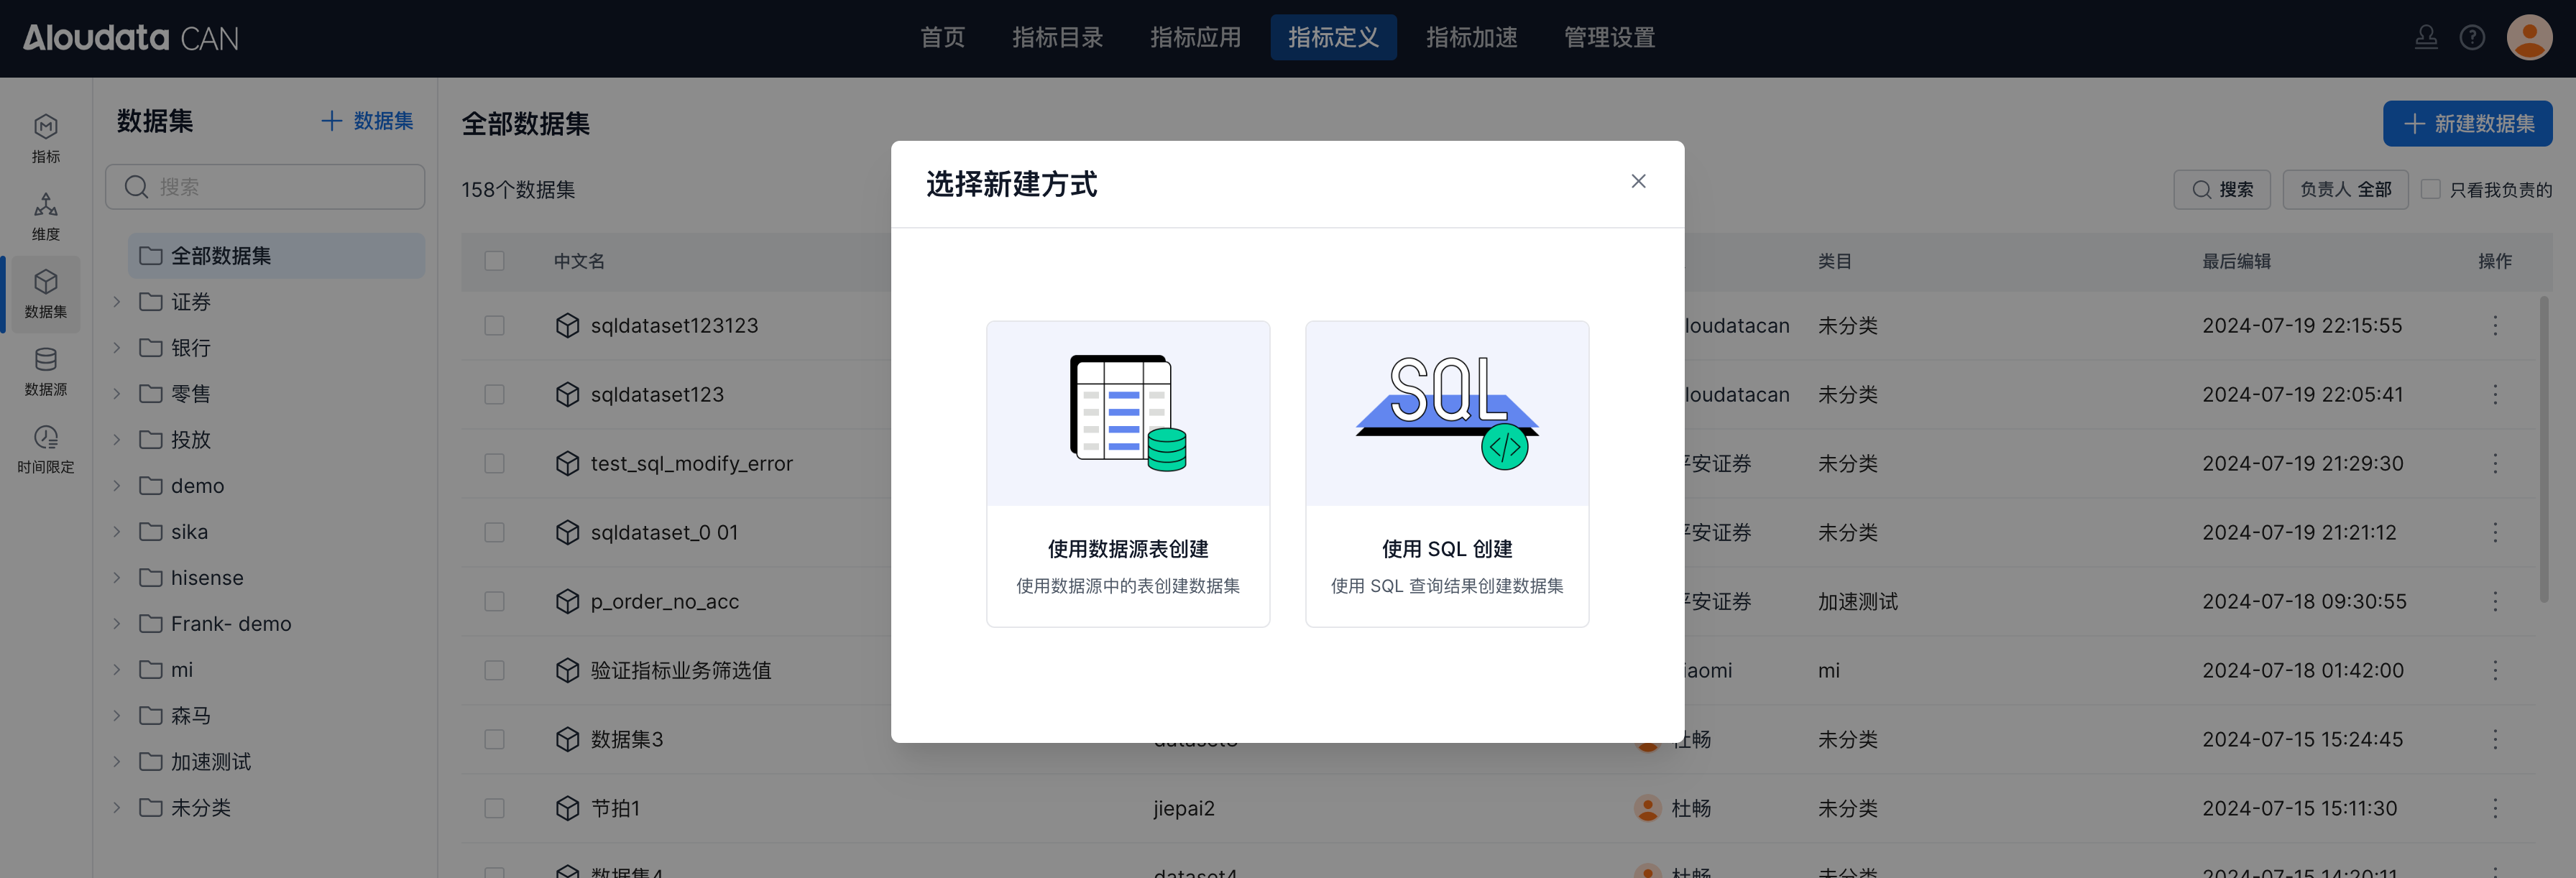
Select Create from data source table. Under File Upload, select the files you just uploaded and use them to create datasets.
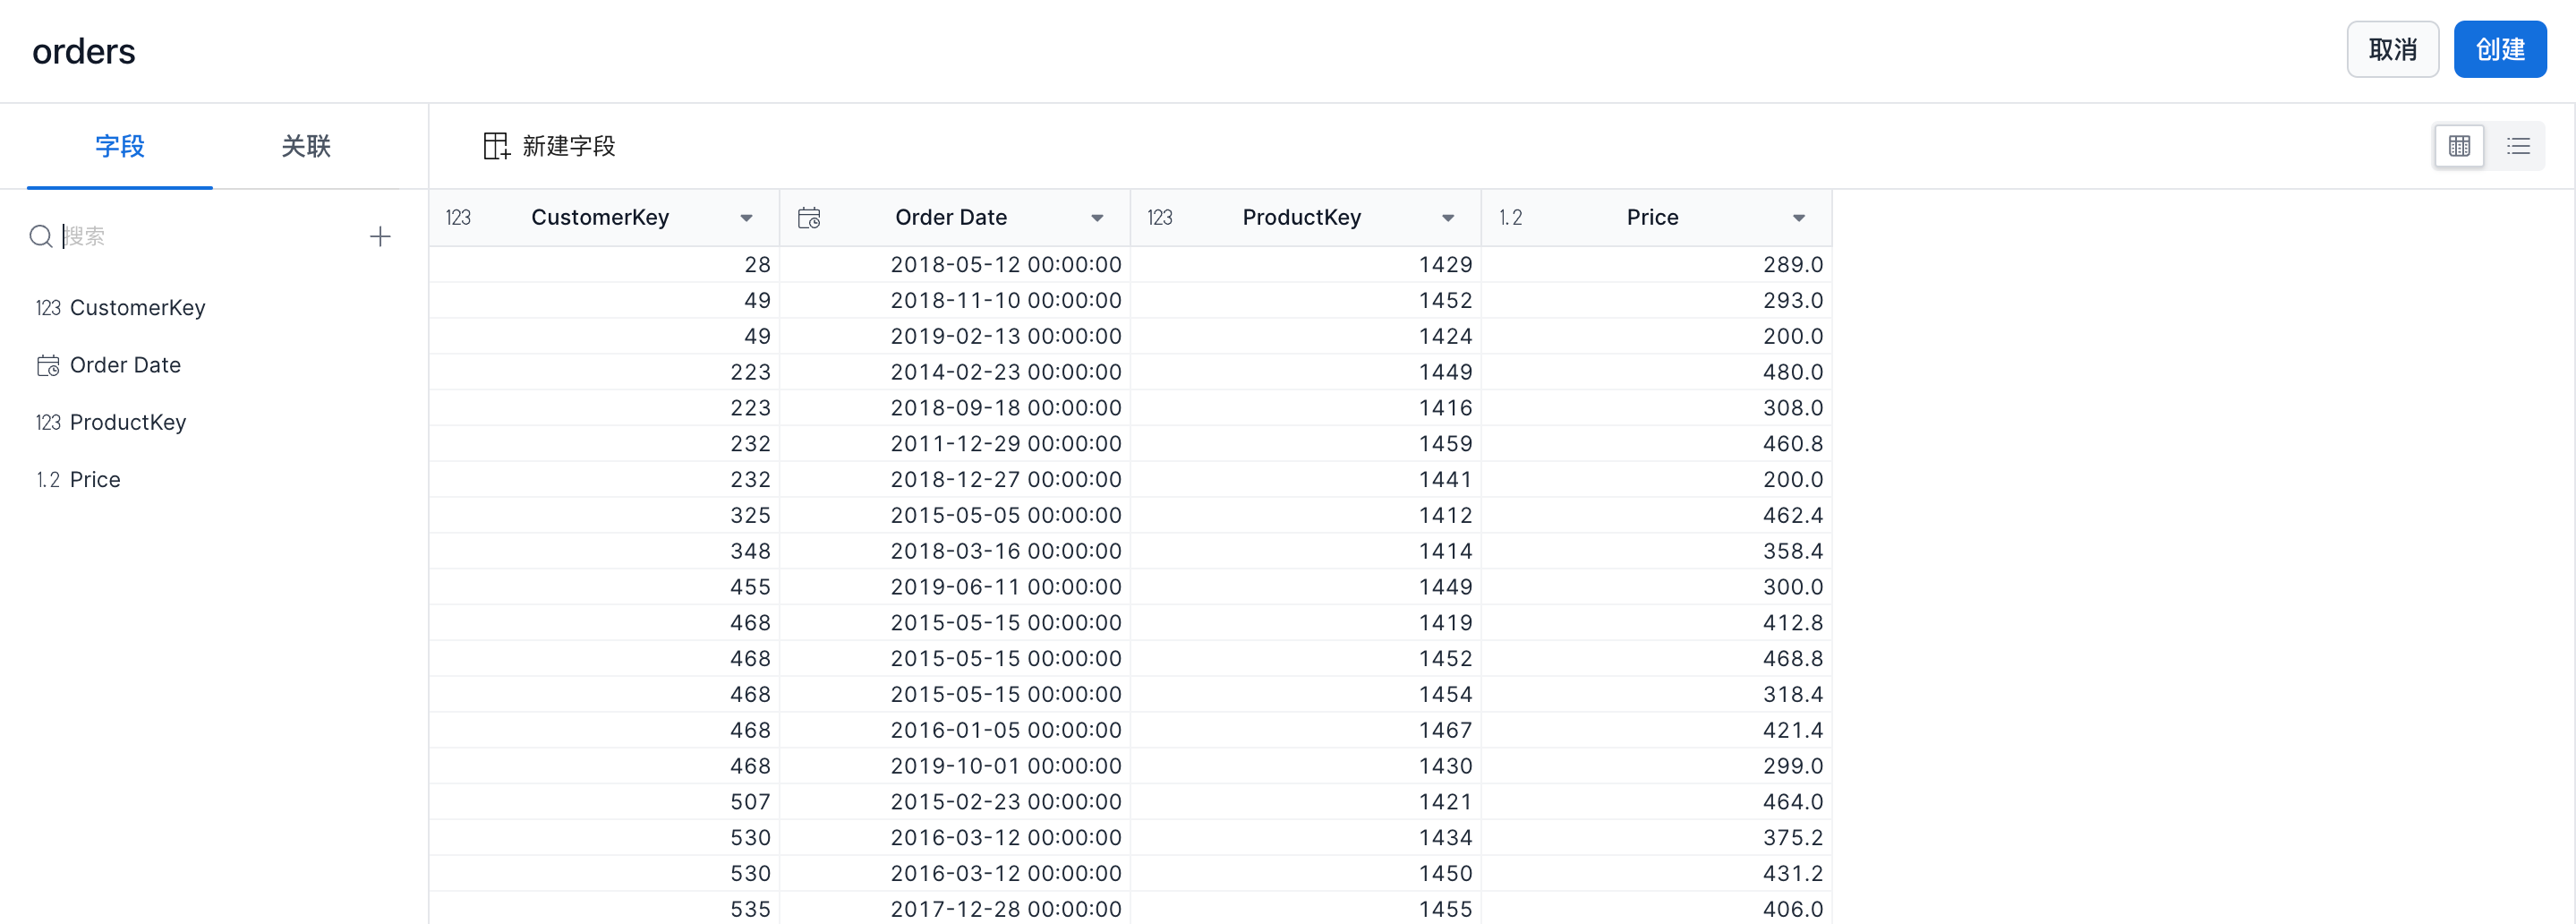
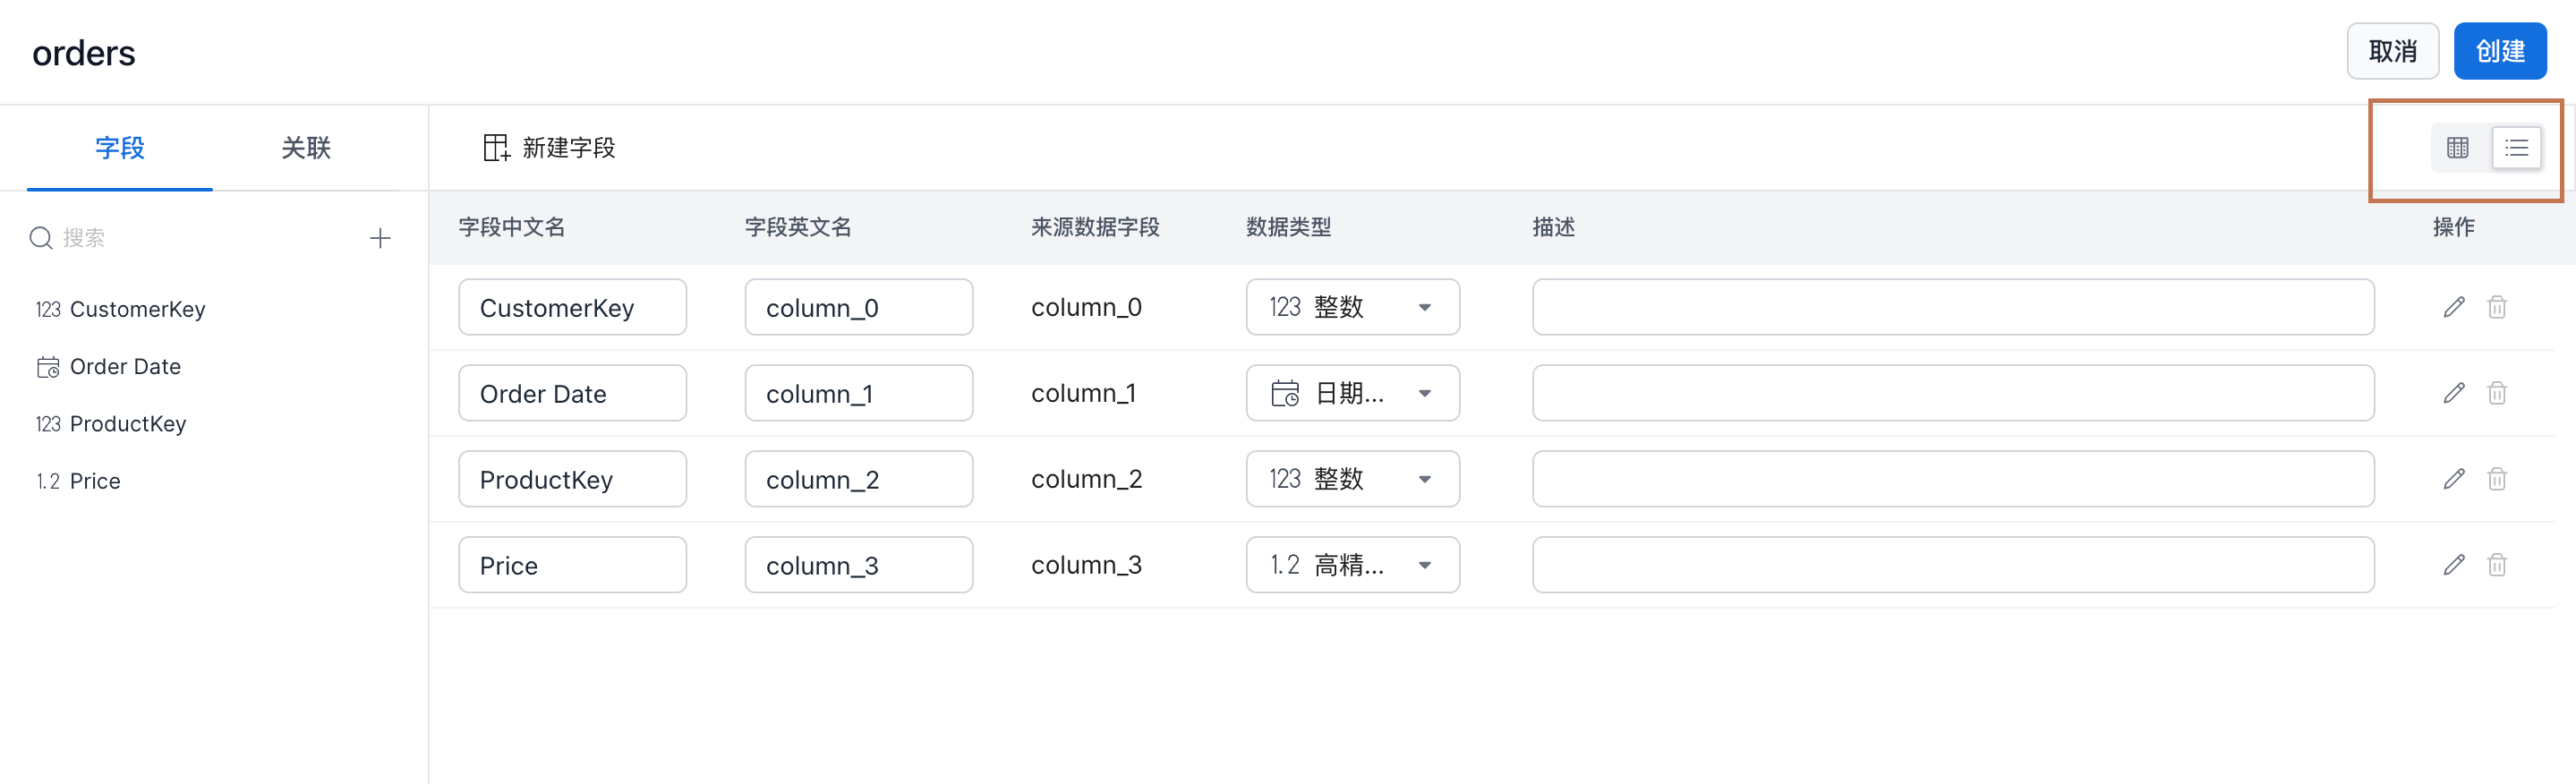
During dataset creation, you can update the display name and add a description so the dataset is easier to understand. Click List View in the upper-right corner to switch to list mode and edit information more efficiently.
To keep this walkthrough simple, this example does not rename fields.
Create a dataset for the customer table in the same way. After both datasets are created, you can find them in the dataset list.
Step 3: Configure Relationships
After importing the orders and customer tables, create a relationship between them. Click orders, then open the Relationship tab.
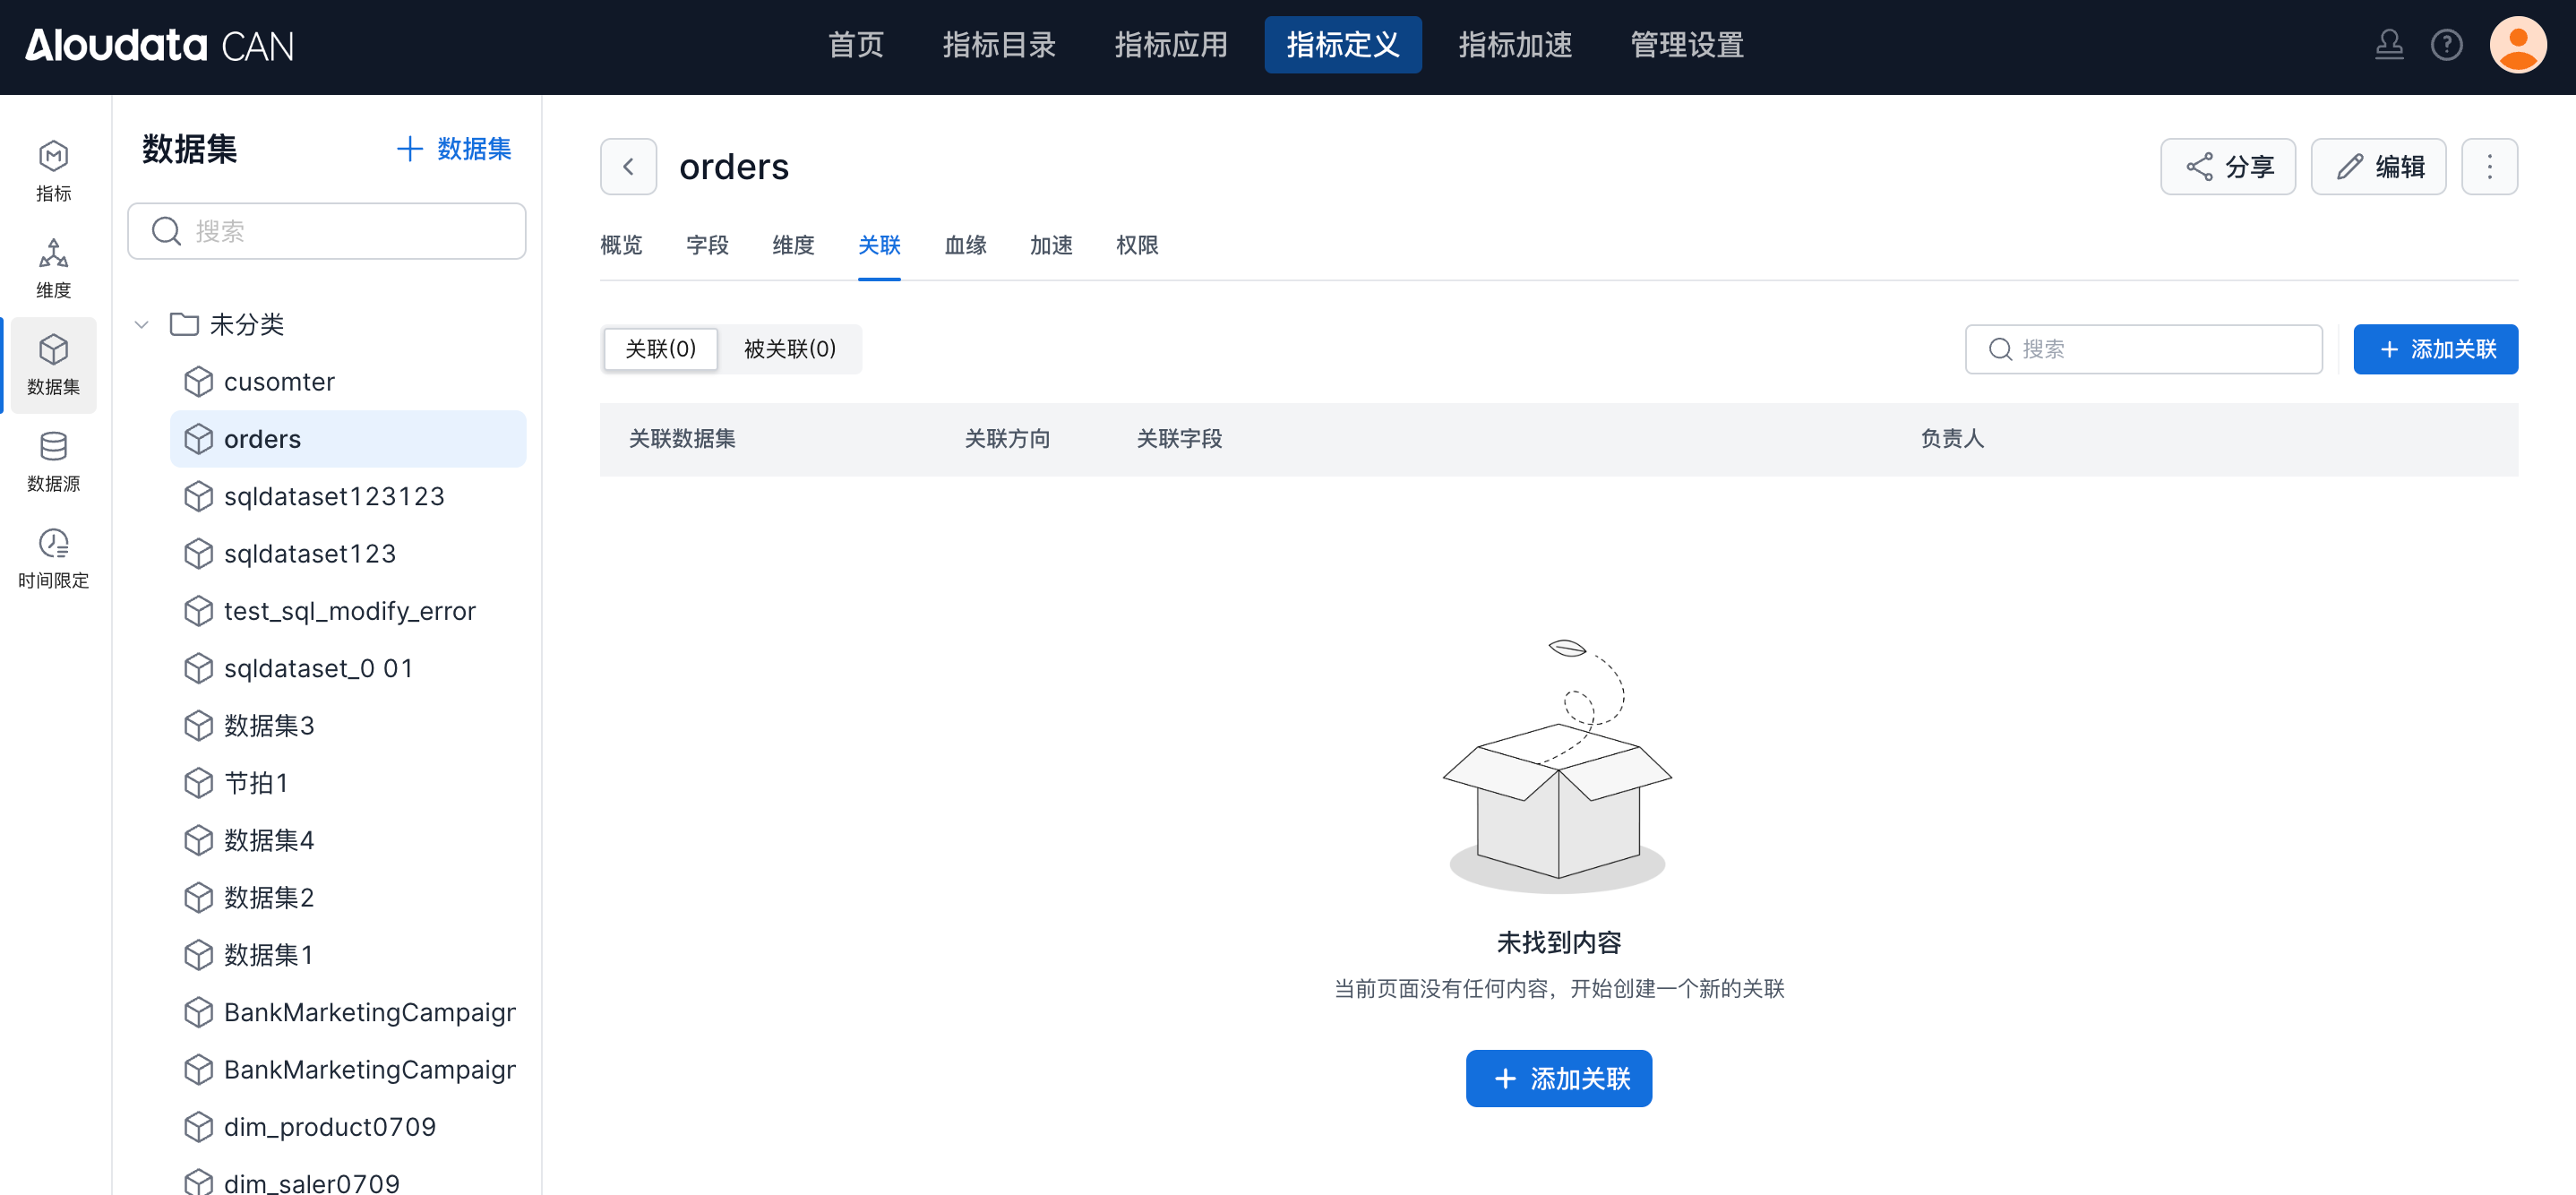
In the sample data, customer stores user information, with one row per user. orders stores order information, and each user may have multiple order records. Configure a relationship between the two datasets.
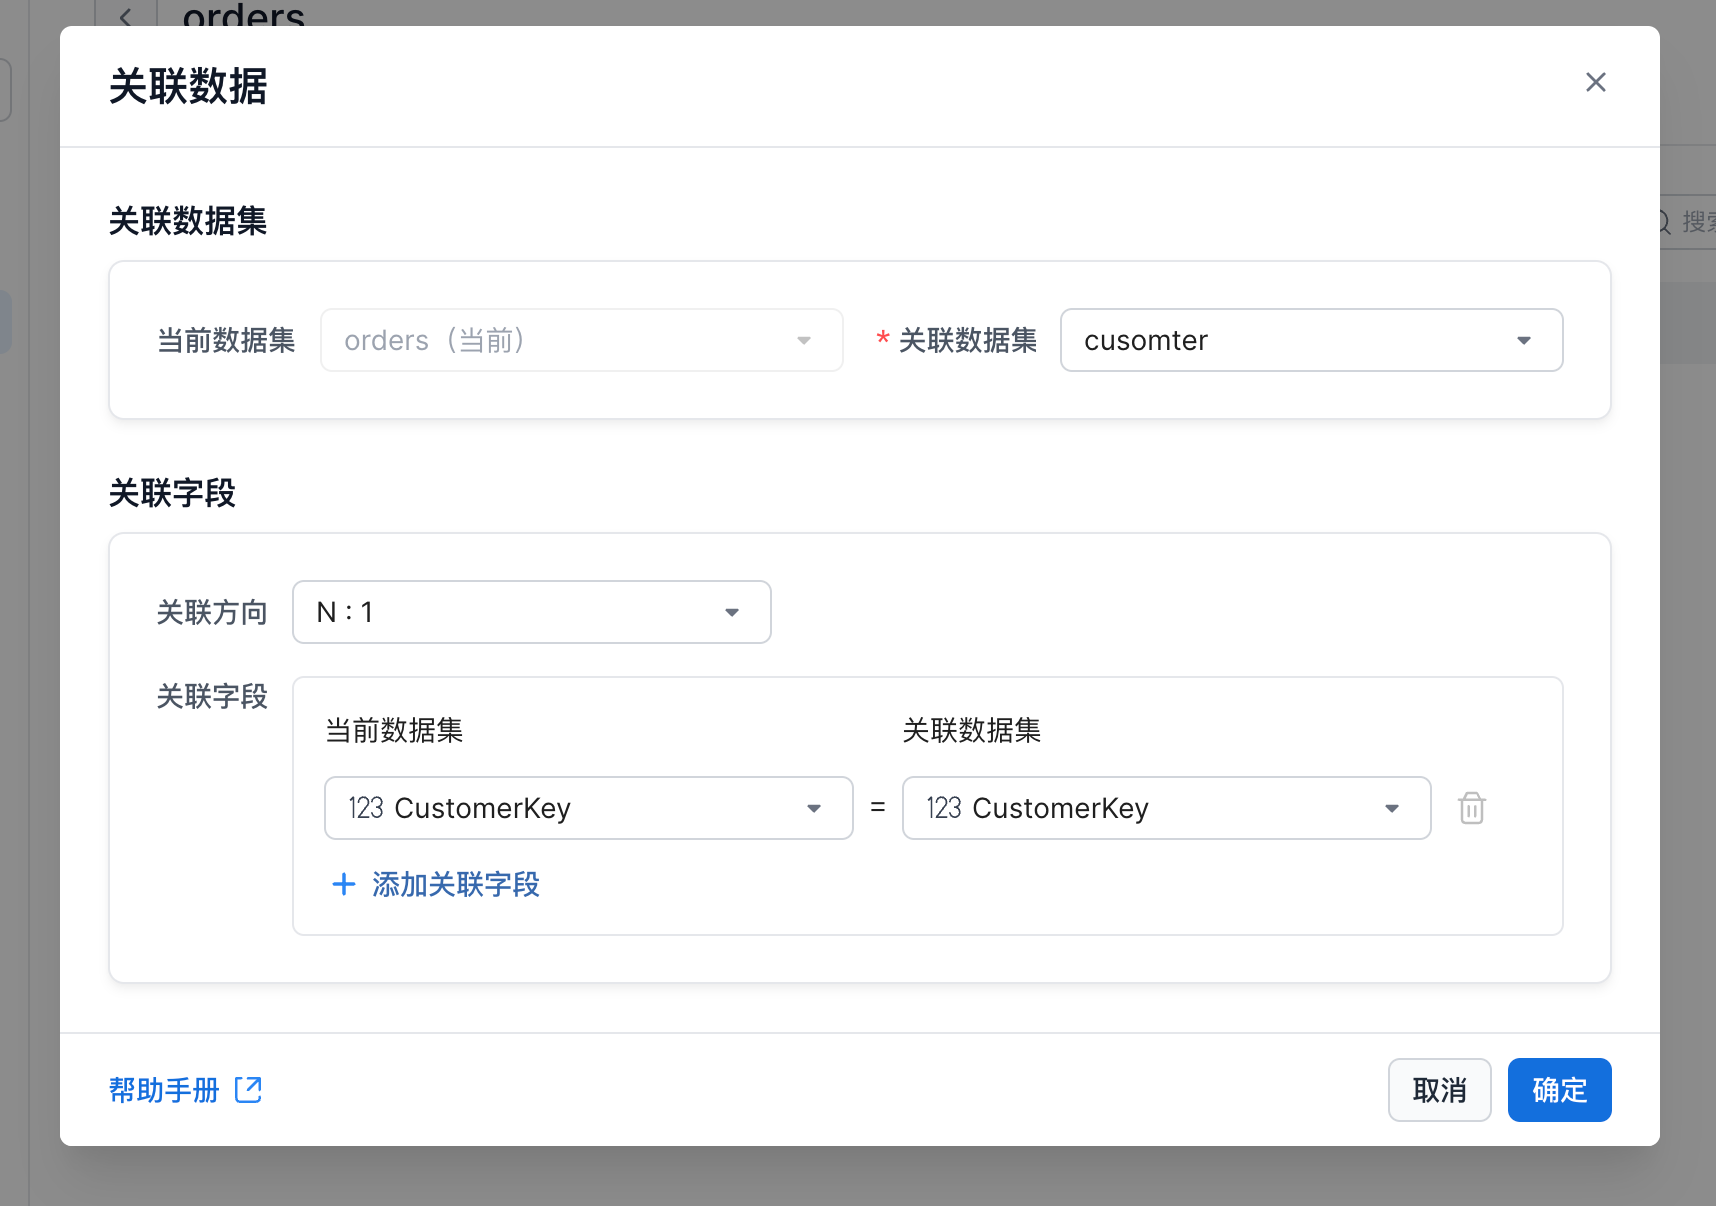
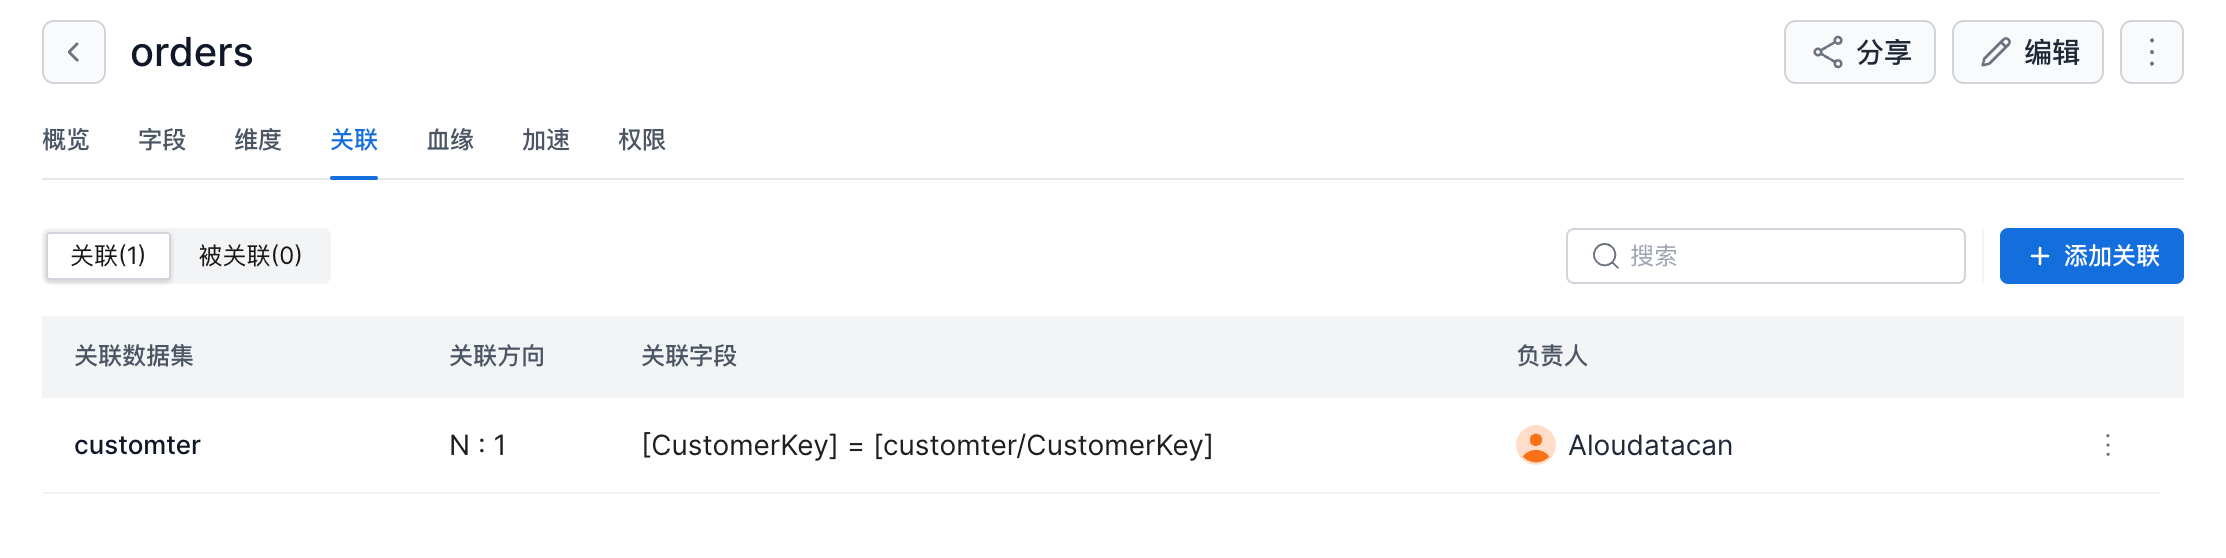
Set the relationship direction to N:1 and set the join field to CustomerKey = CustomerKey. This means multiple records in the orders dataset can have the same CustomerKey, and those records correspond to one row in the customer table.
Step 4: Configure Dimensions
Next, configure dimensions for multidimensional analysis. Click the customer dataset and open the Dimension tab.
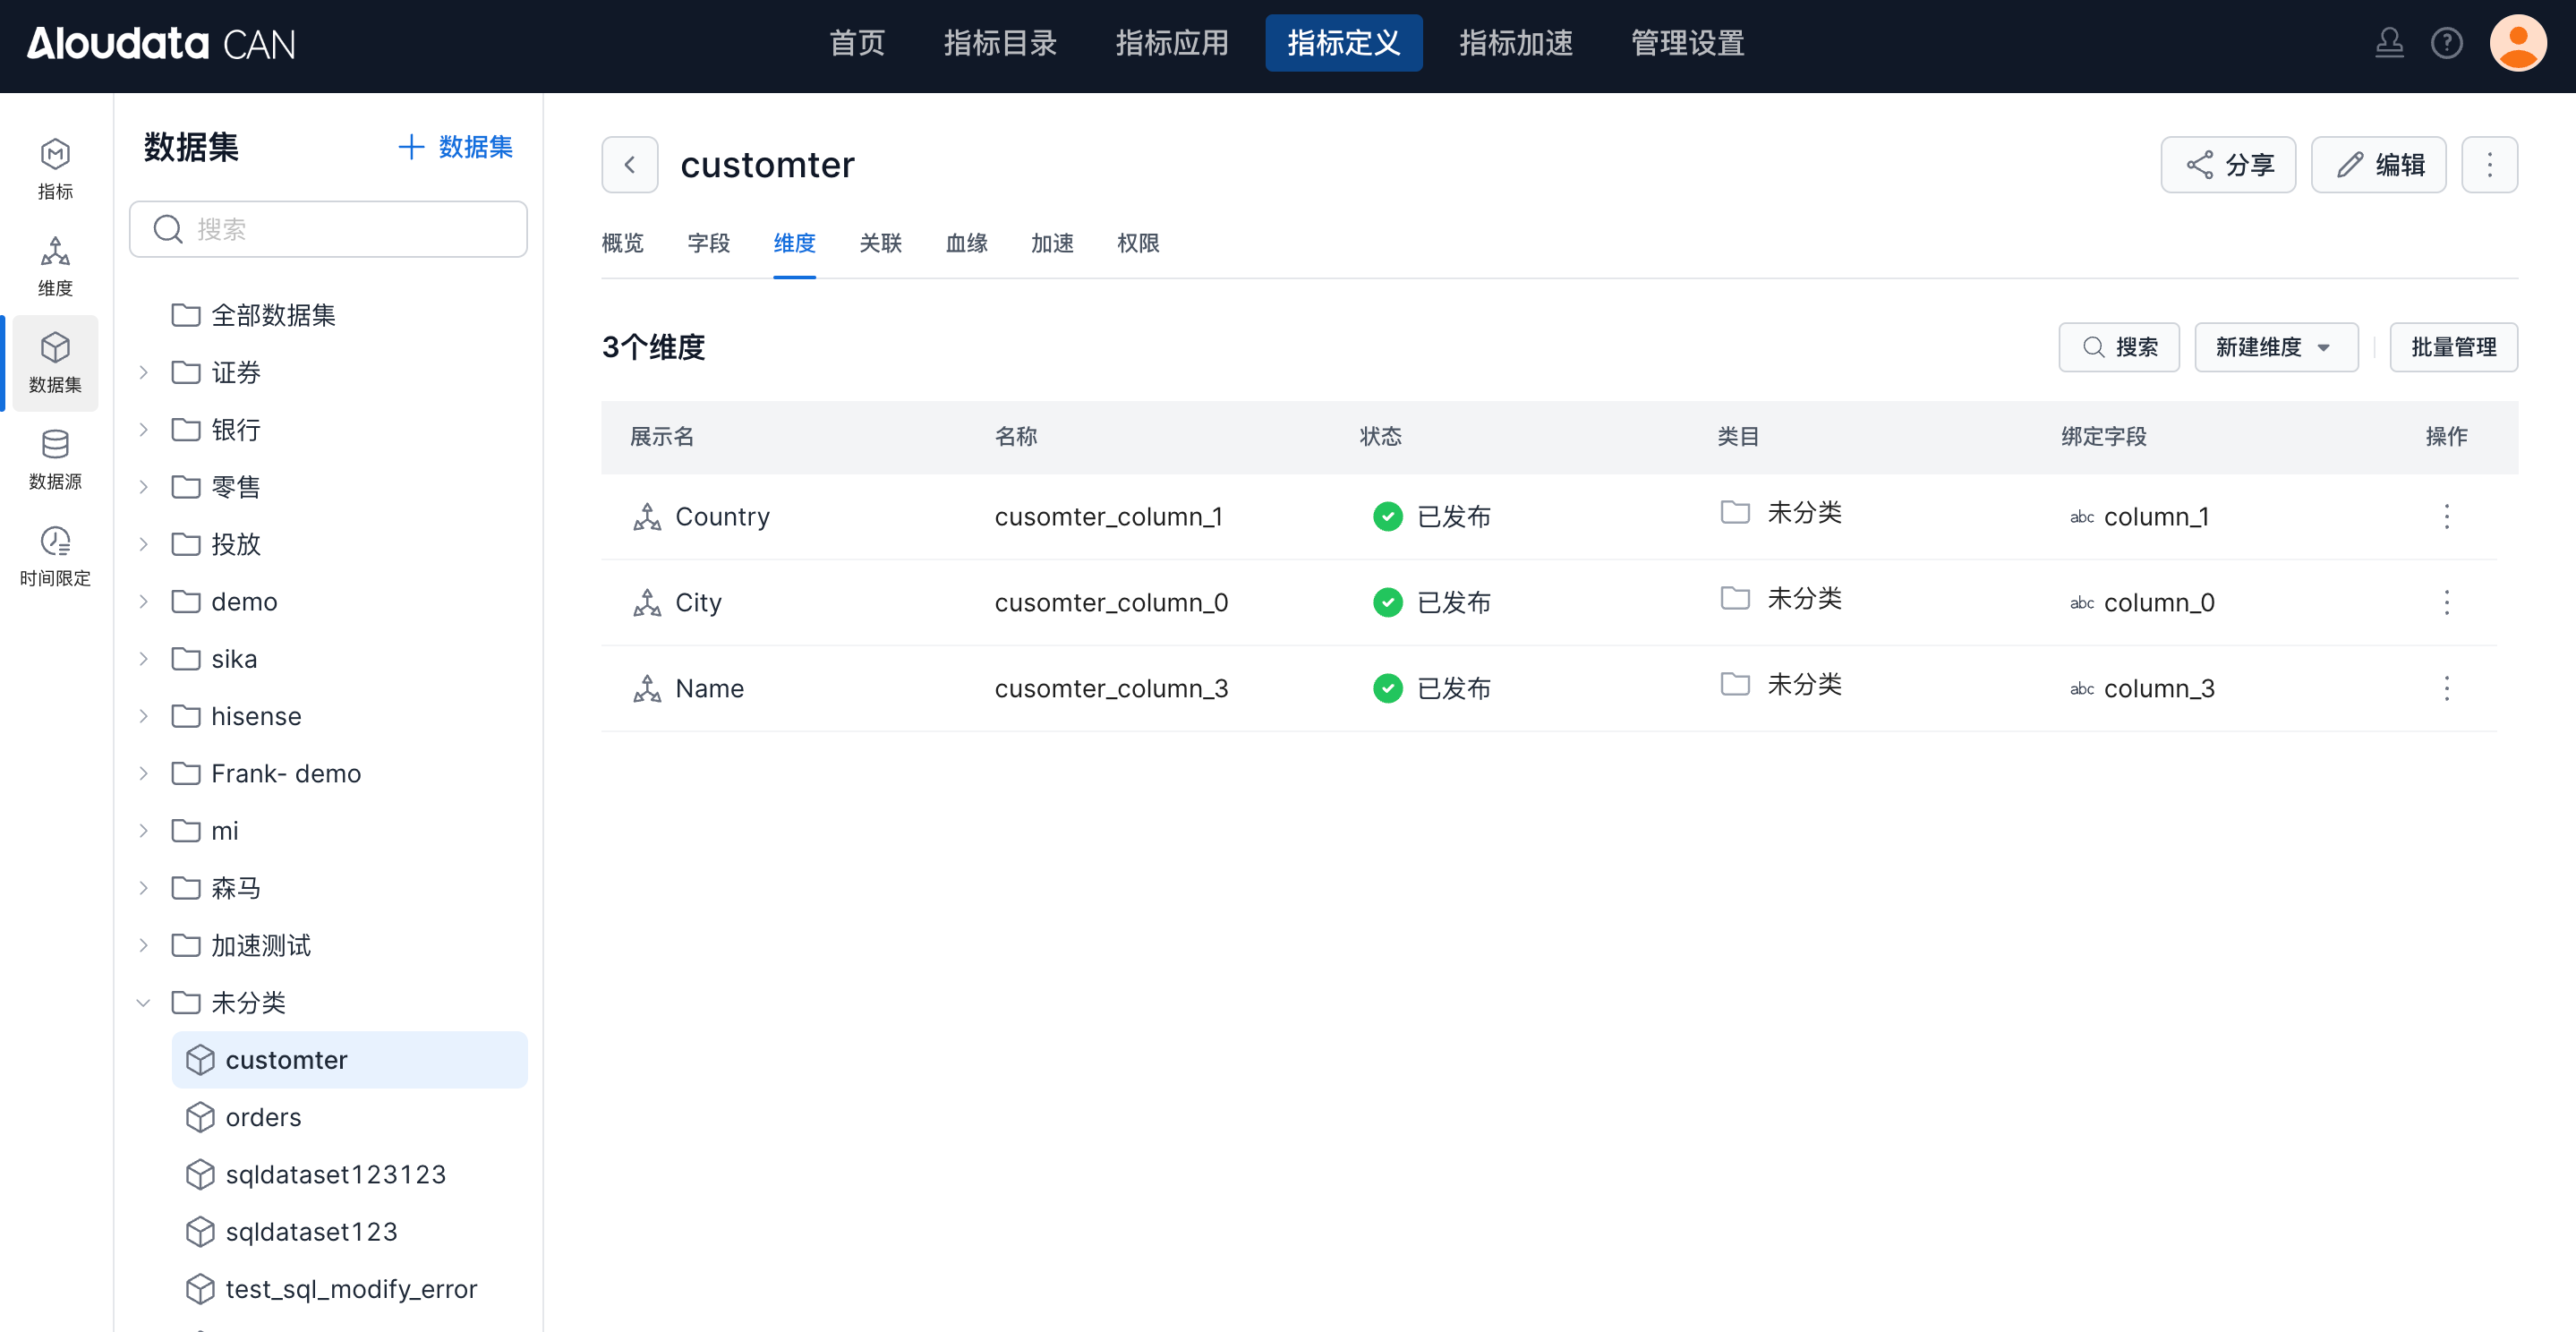
Click Batch Management to enter batch management mode. You can update dimension display names, dimension names, and add new dimensions in bulk.
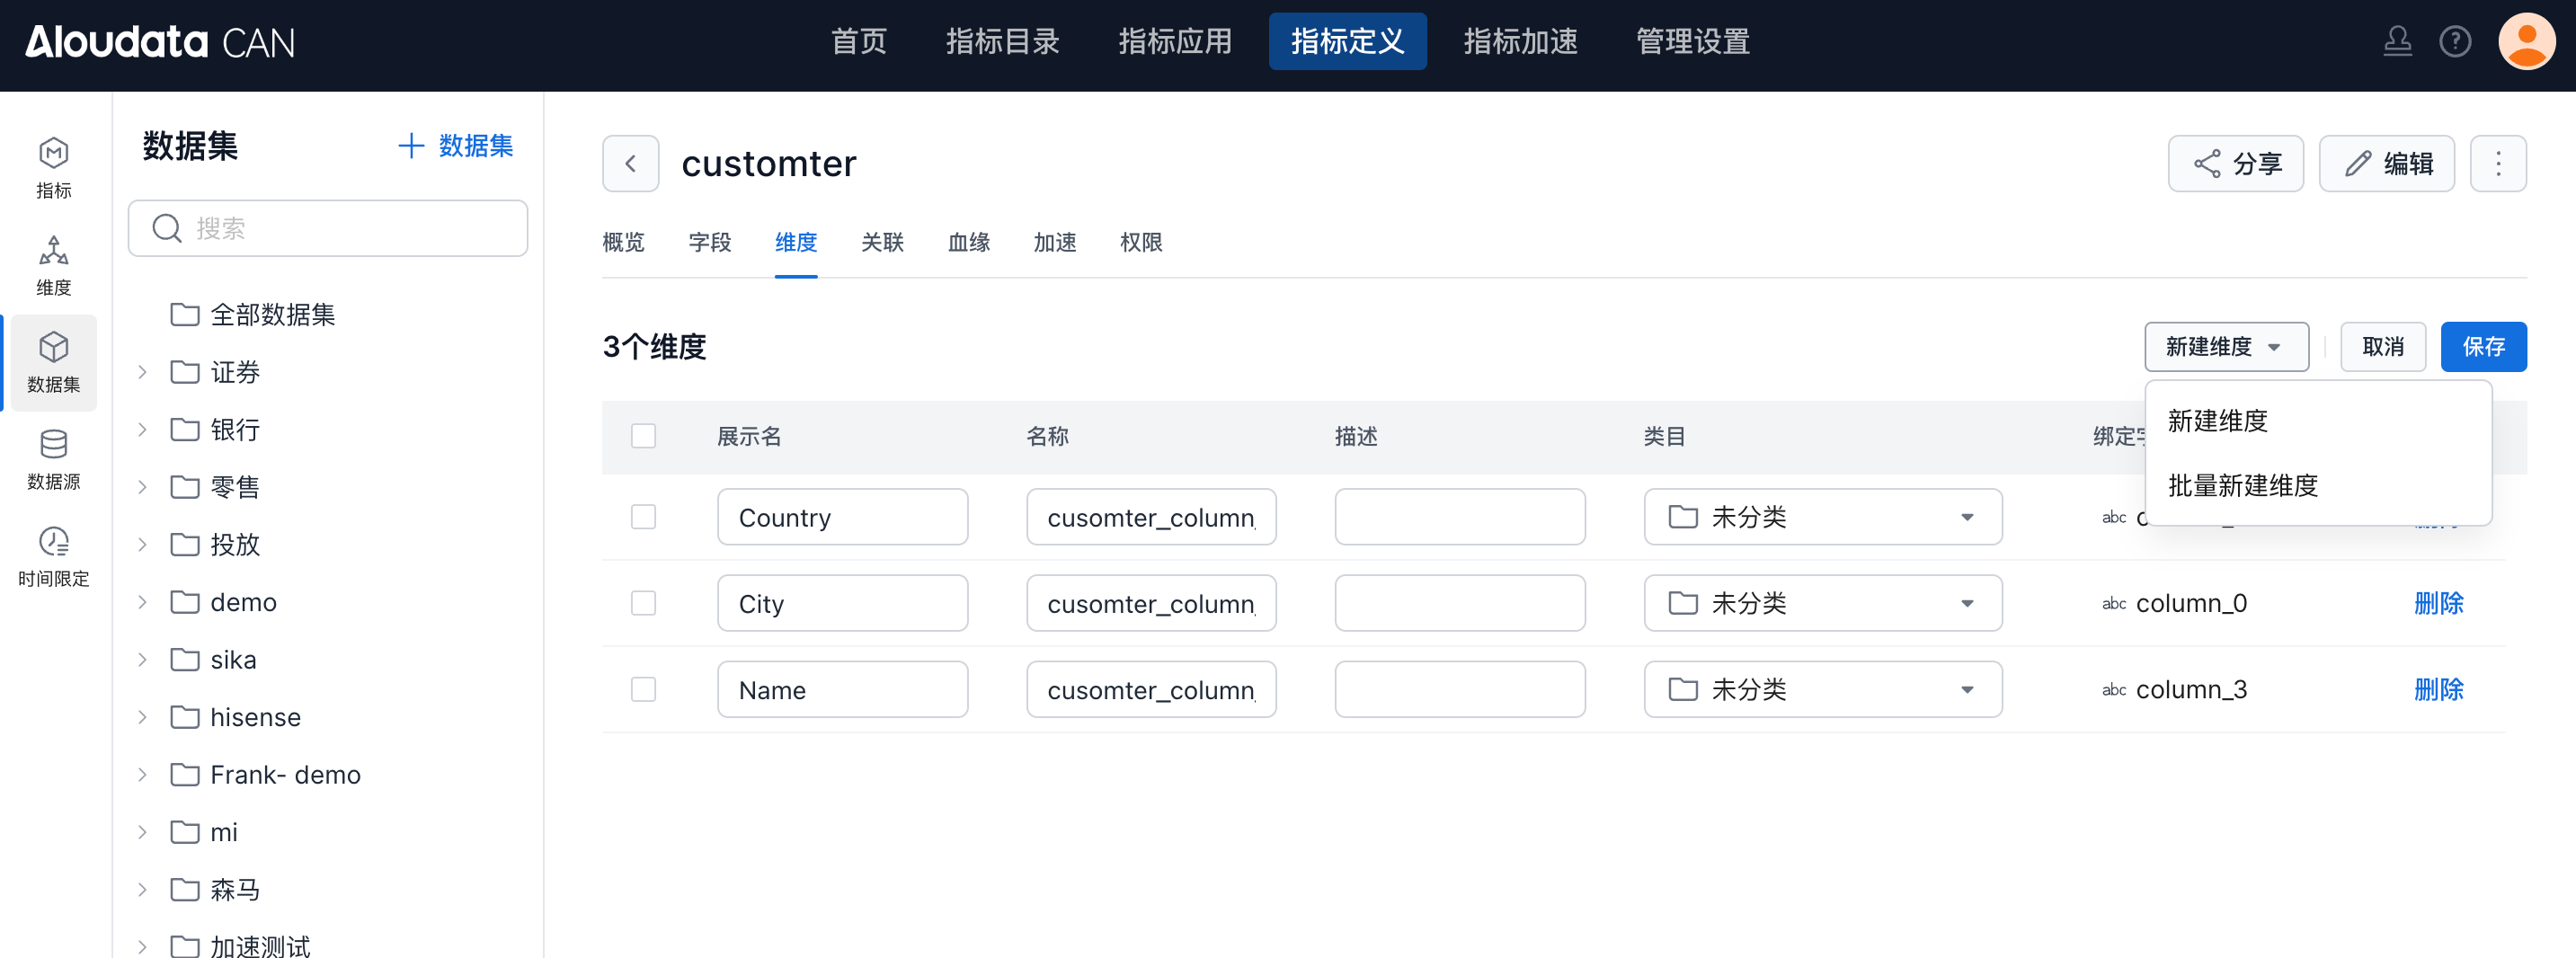
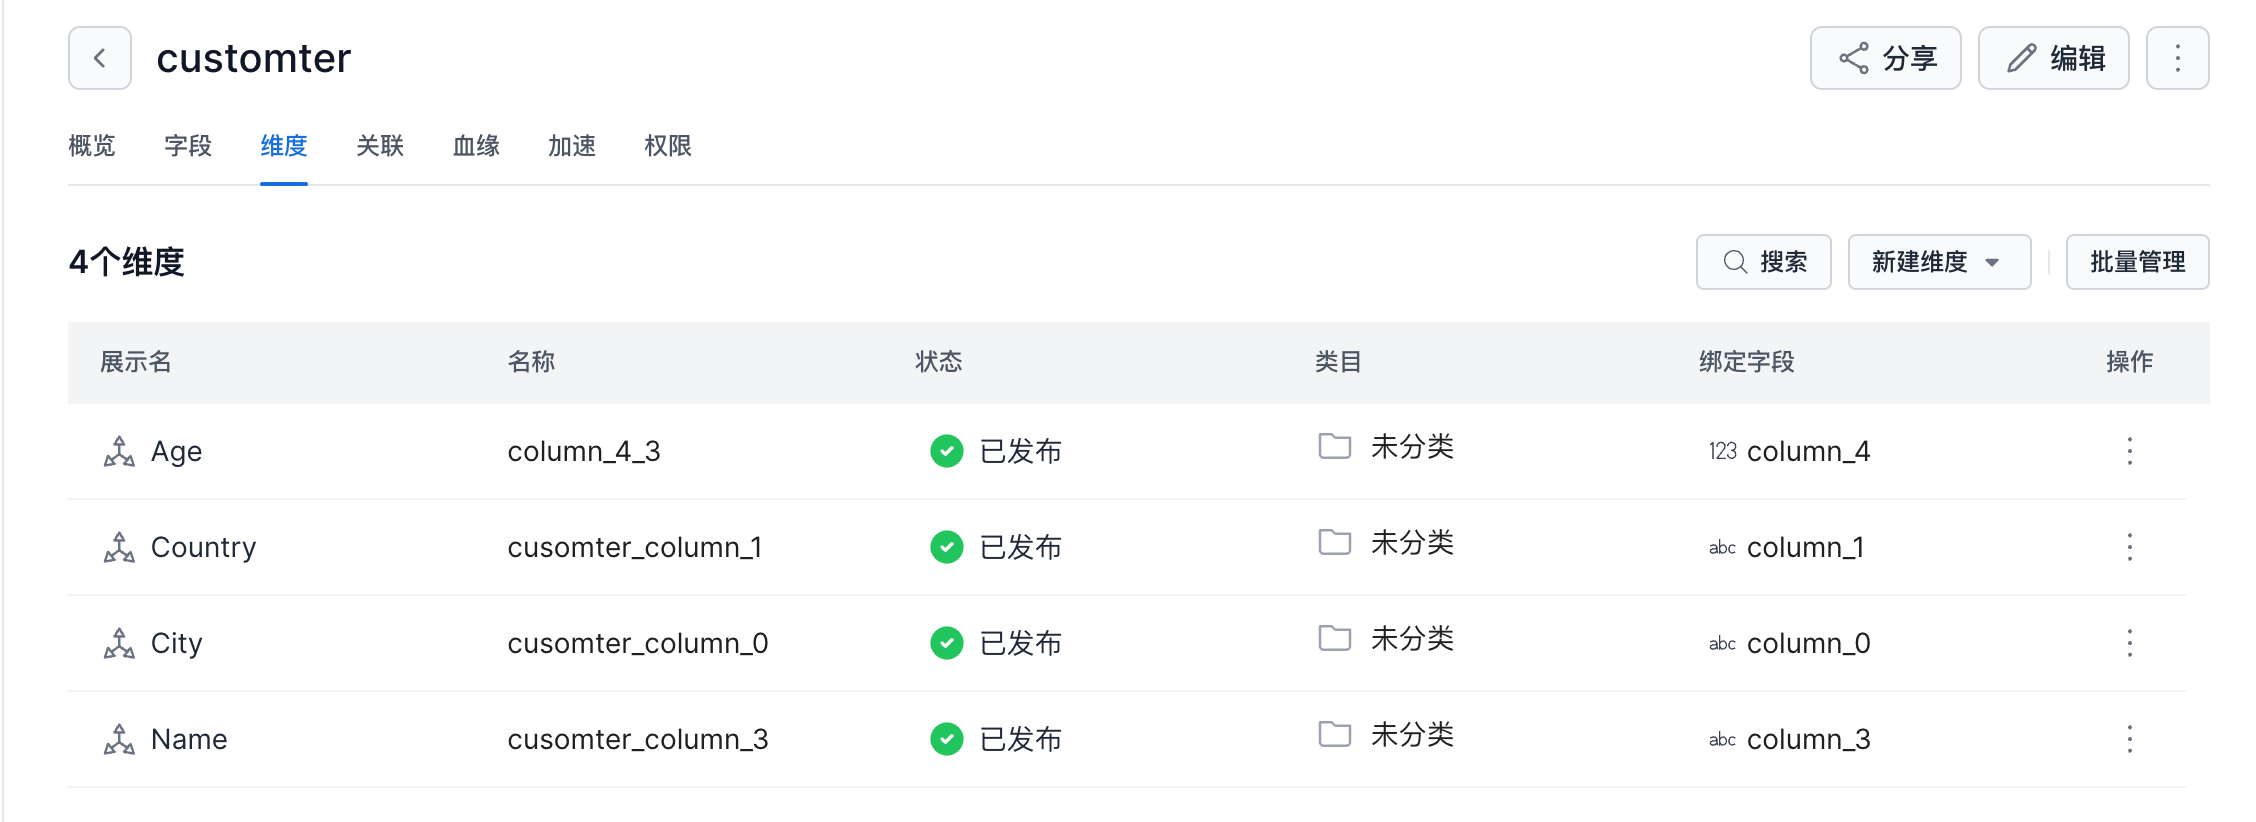
Add Age as a dimension.
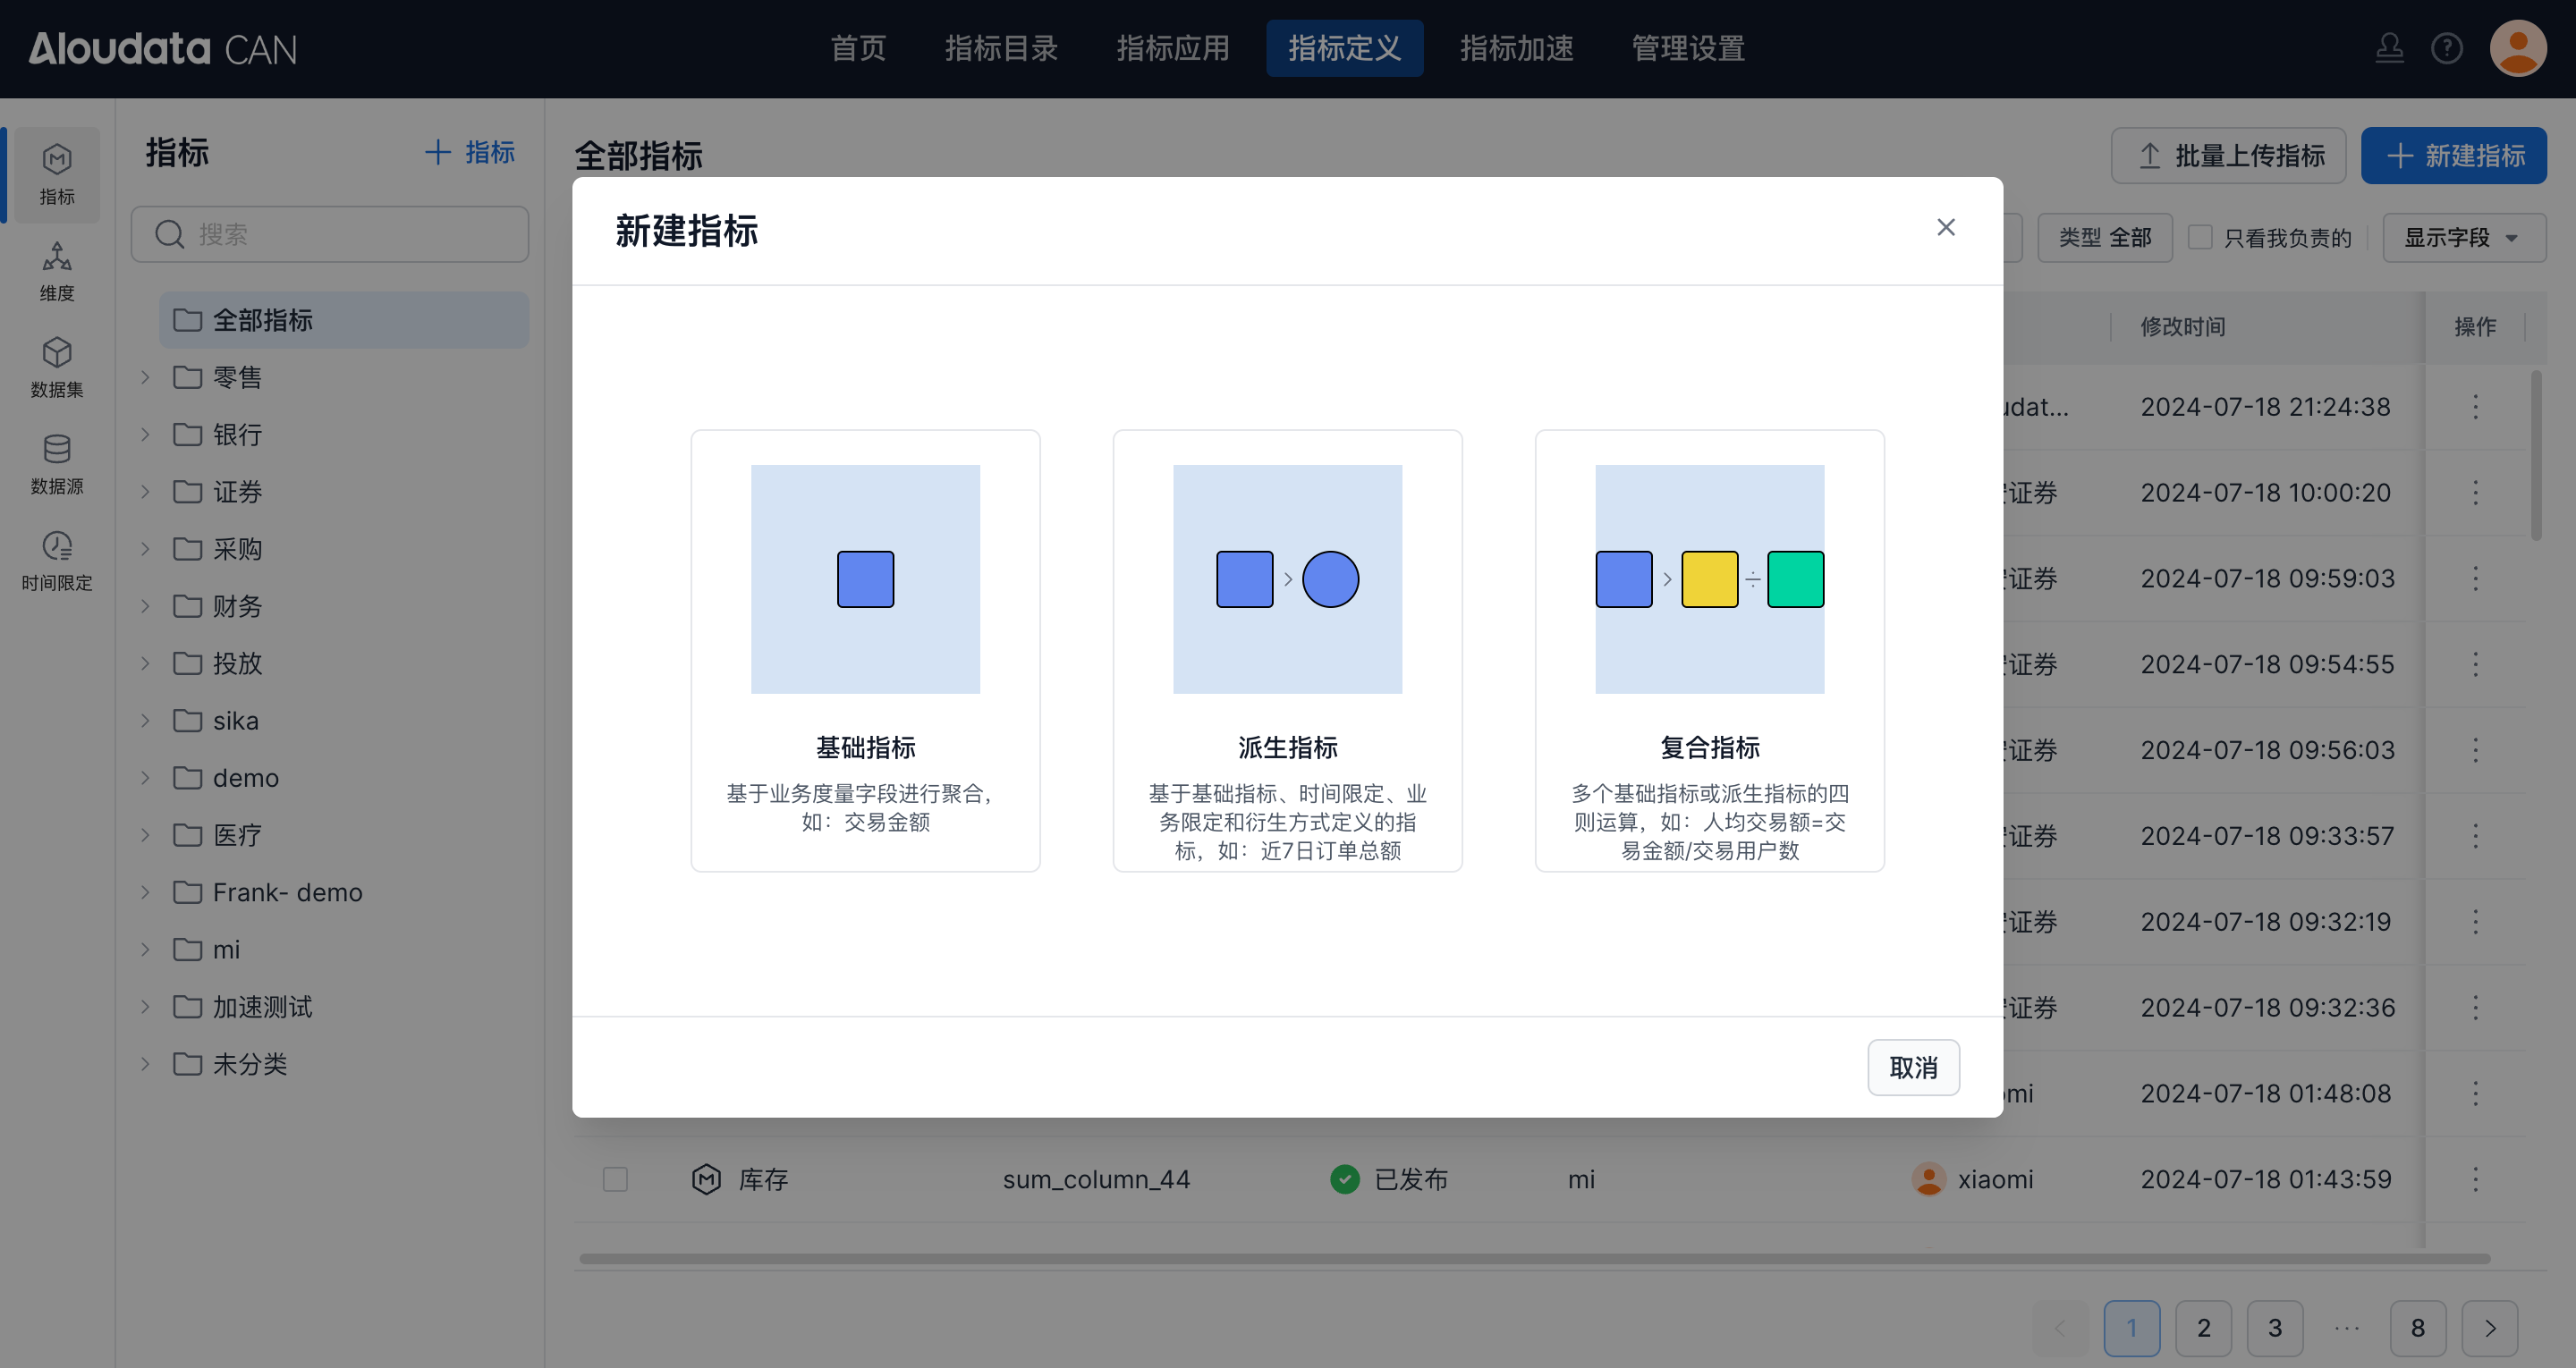
Step 5: Create Metrics
Click Metric in the left navigation, click Create Metric, and select Basic Metric.
Create the first metric, Total Order Amount.
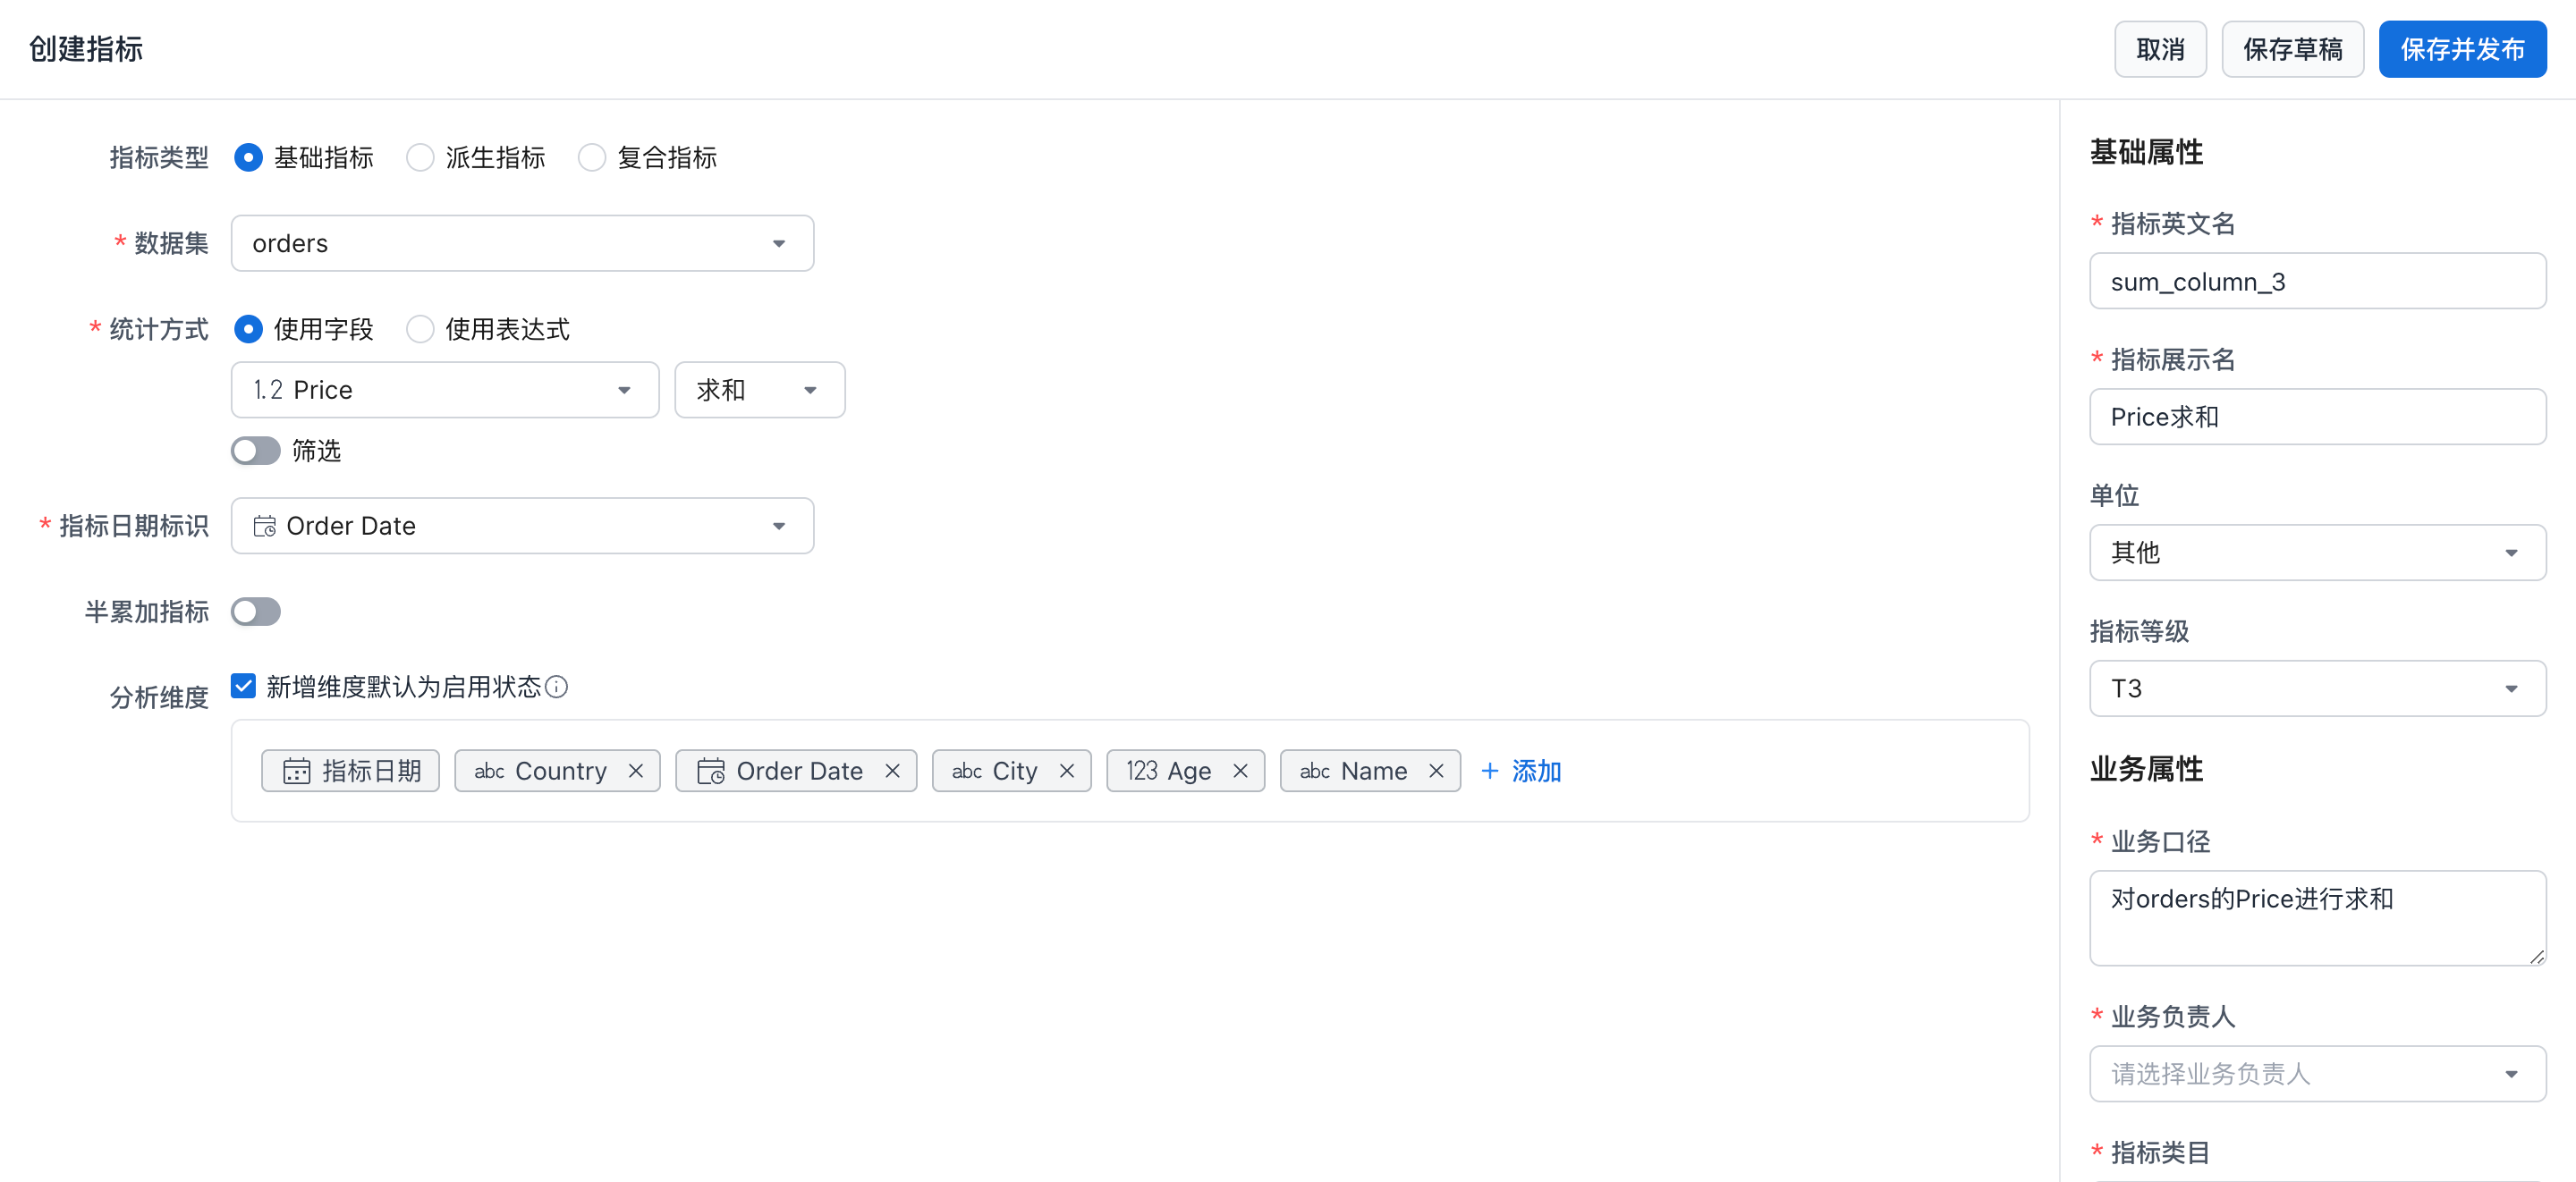
| Configuration | Value |
|---|---|
| Dataset | Select orders. |
| Aggregation | Select Use Field, then configure Price with Sum to calculate the total price. |
| Metric date | Select Order Date so the metric result is calculated by order date. |
| Analysis dimensions | Because the dataset relationship has been configured, the system automatically identifies all available dimensions and adds them as analysis dimensions.  |
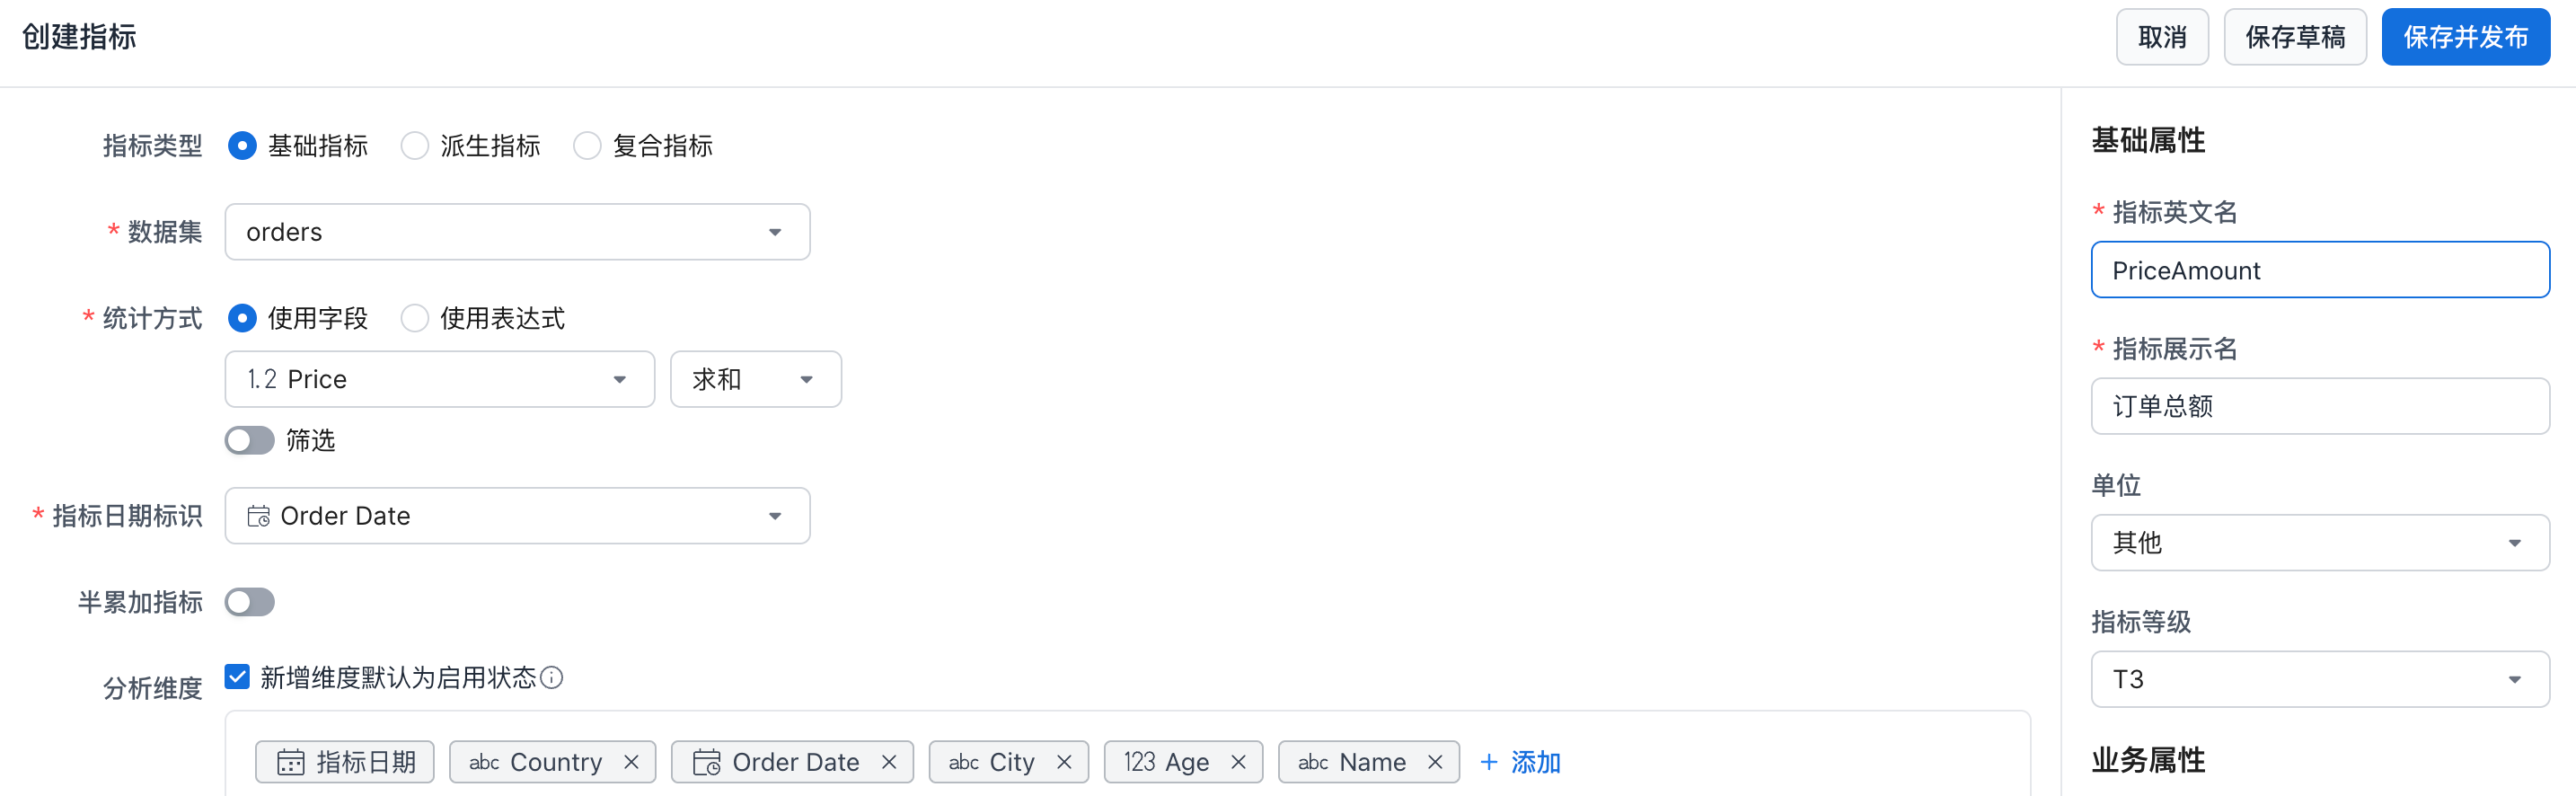
For this walkthrough, fill in the metric's English name and display name. After completing the required information, click Save and Publish.
Next, create a derived metric to calculate Total Order Amount in the Last 7 Days.
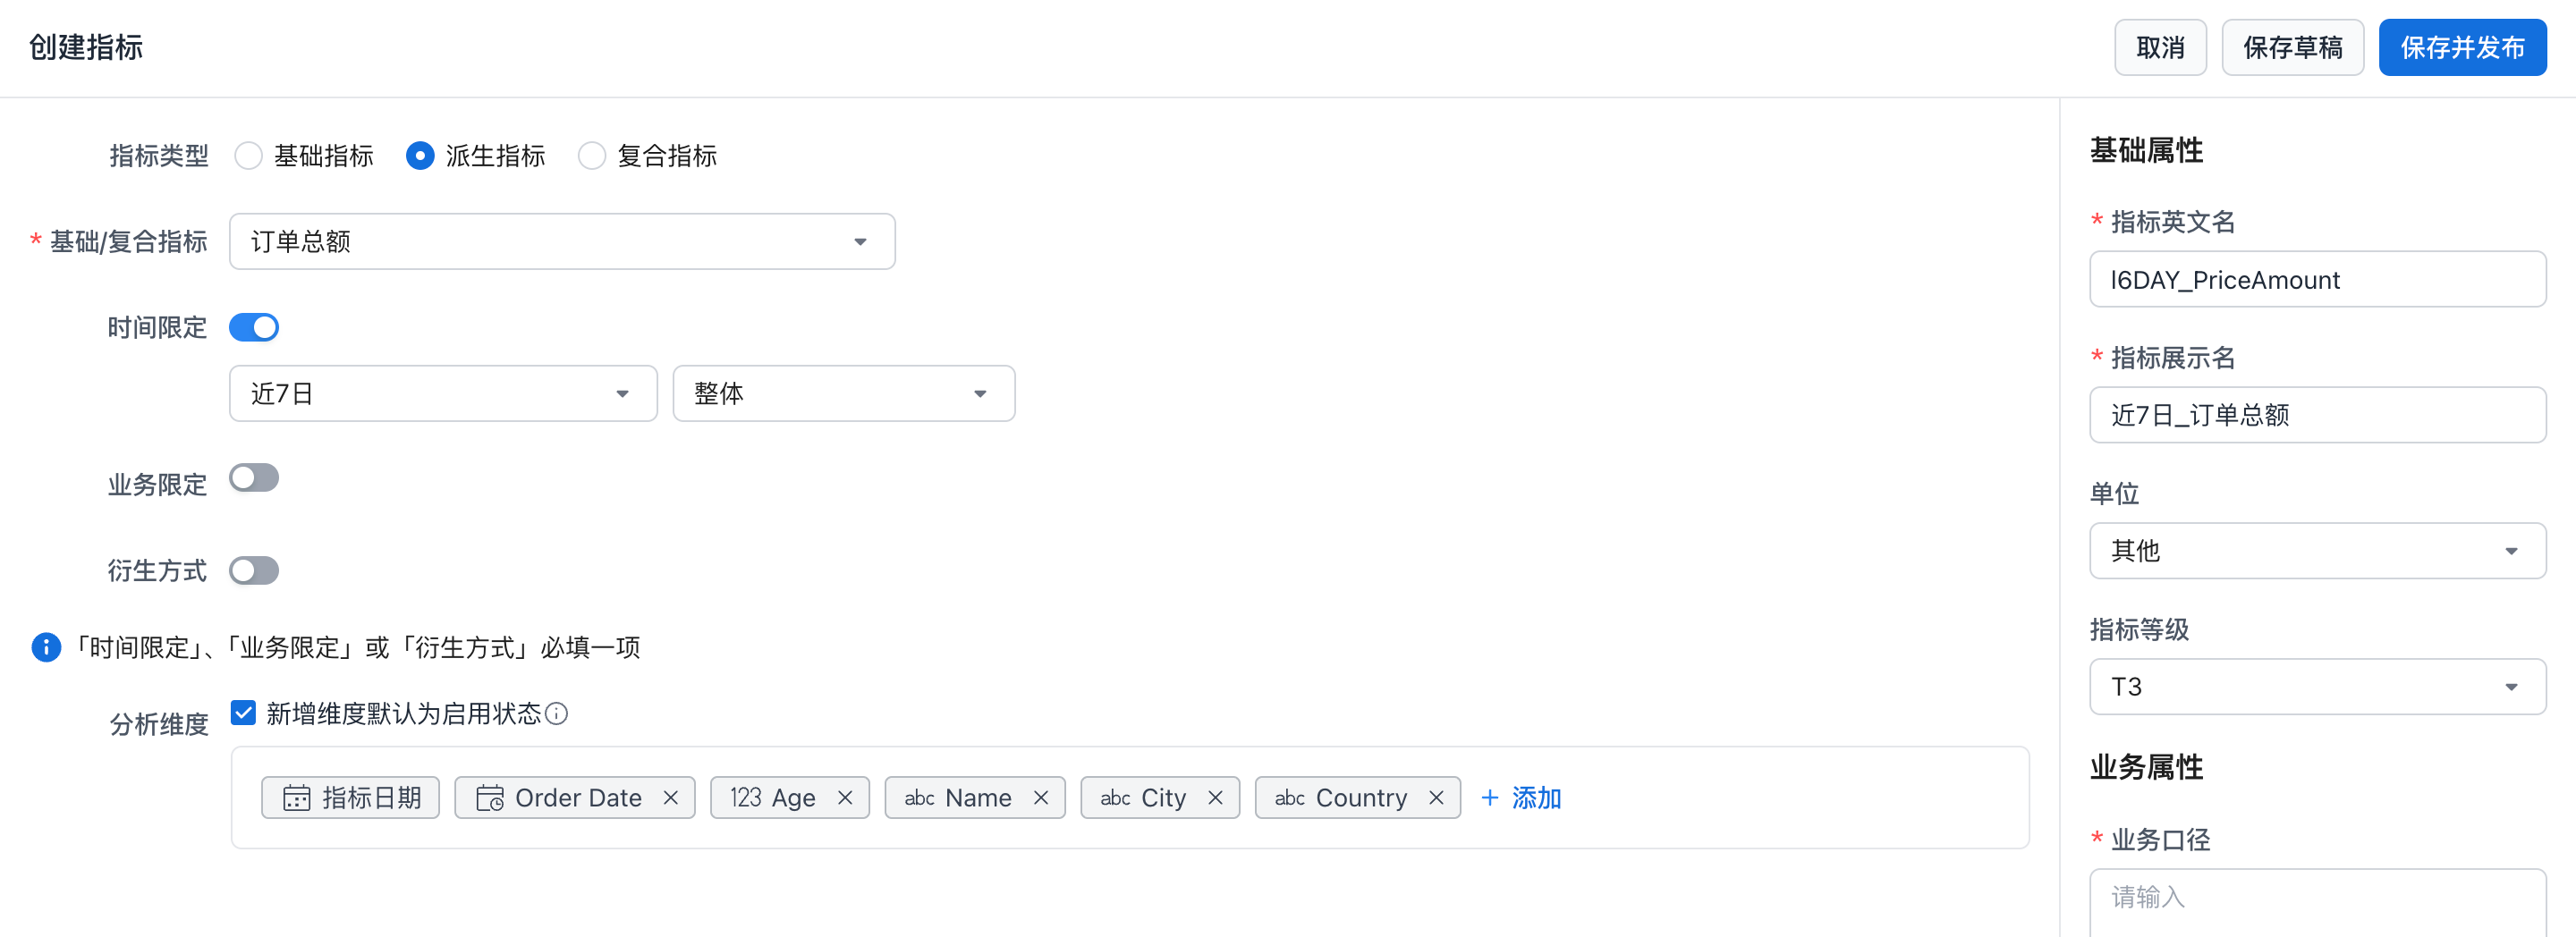
| Configuration | Value |
|---|---|
| Basic/composite metric | Select the Total Order Amount metric created earlier. |
| Time constraint | Enable the time constraint and set it to Last 7 Days. |
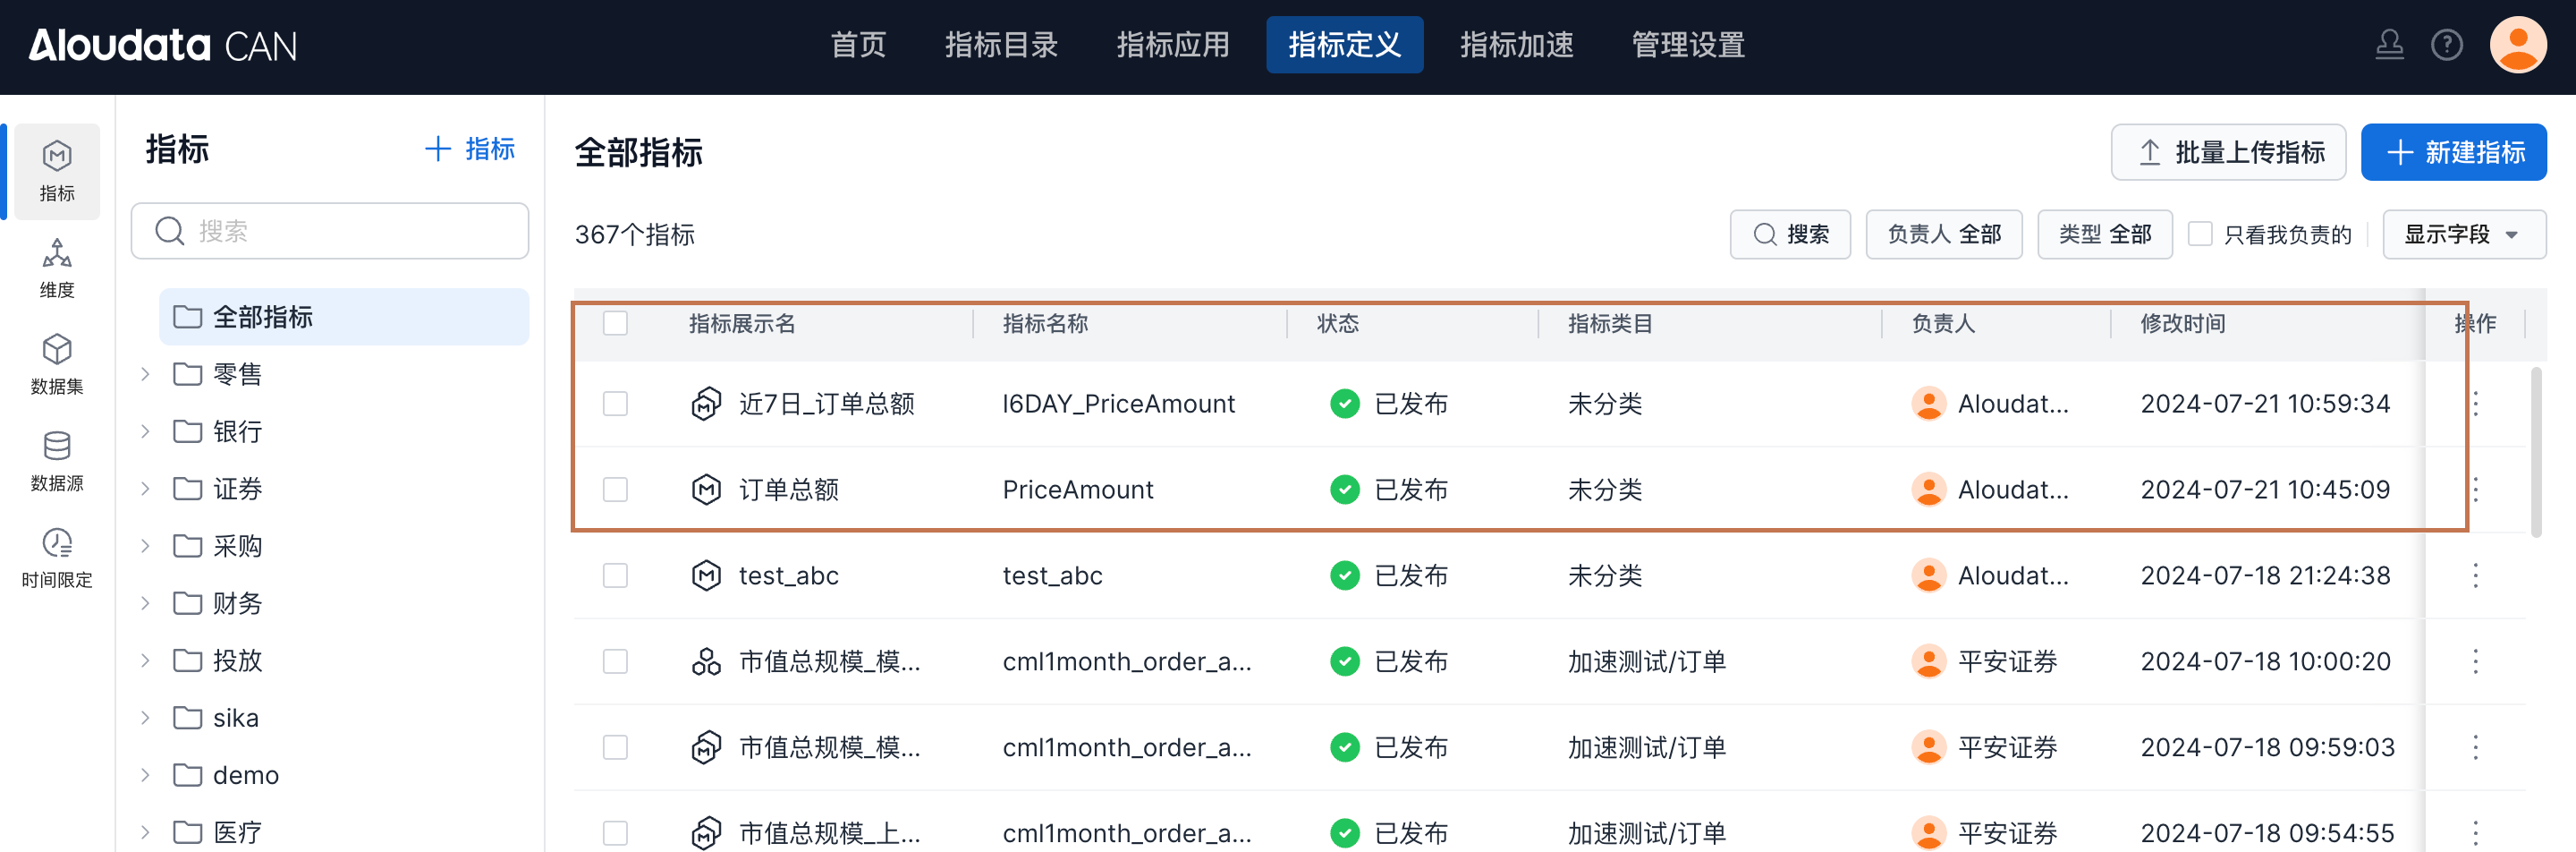
You can now see the two newly created metrics in the metric list.
Step 6: Analyze Metrics In A Dashboard
Click Metric Application -> Metric Dashboard -> Create Metric Dashboard.
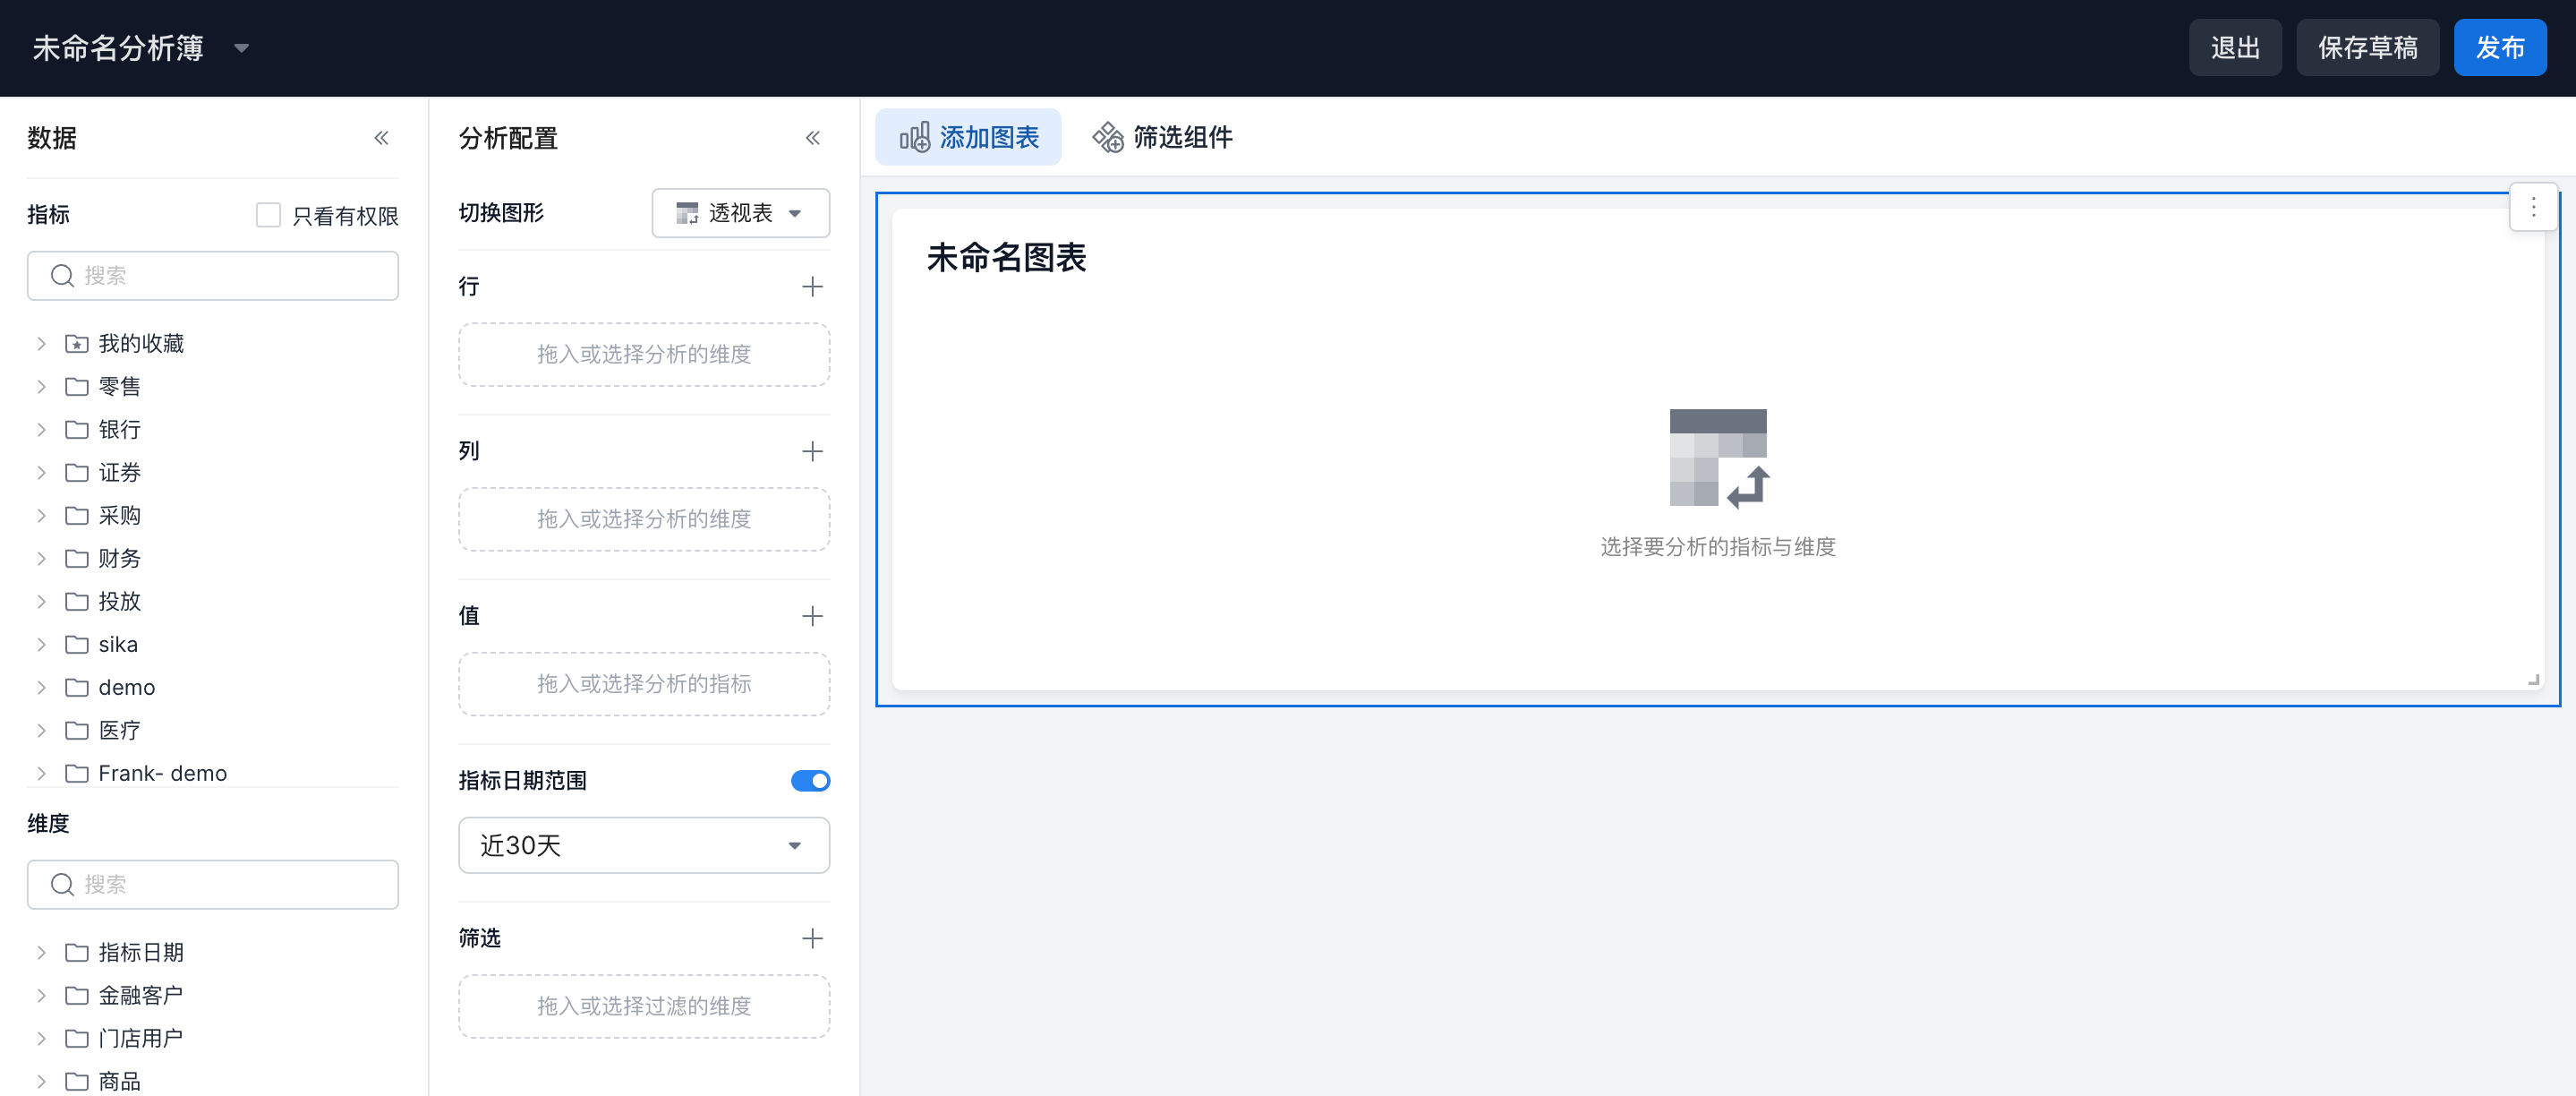
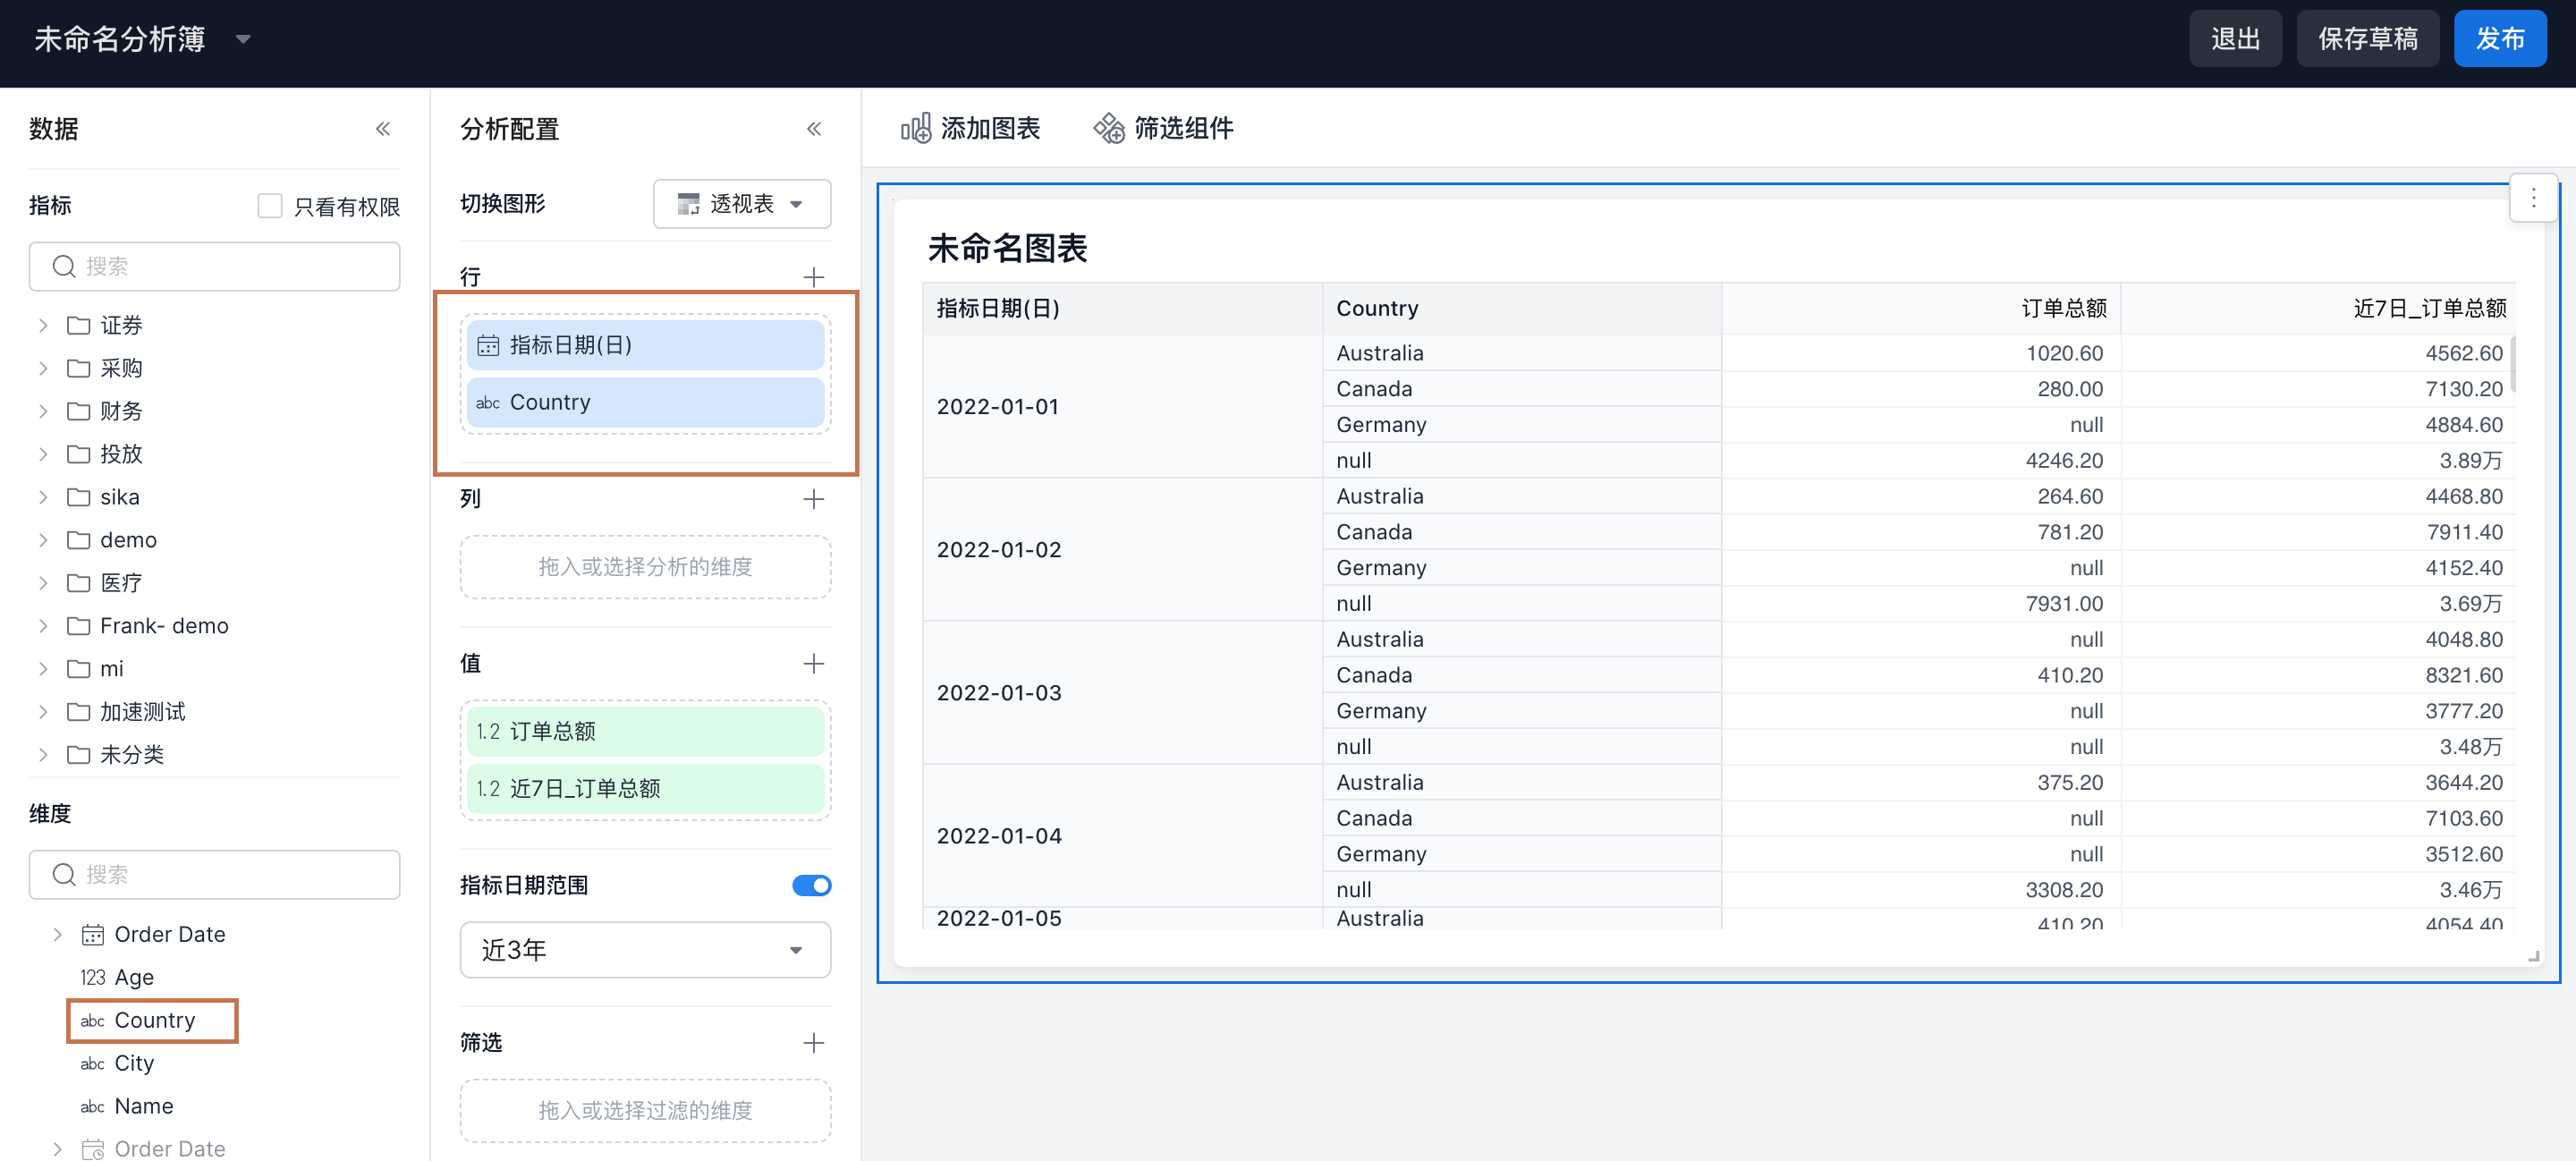
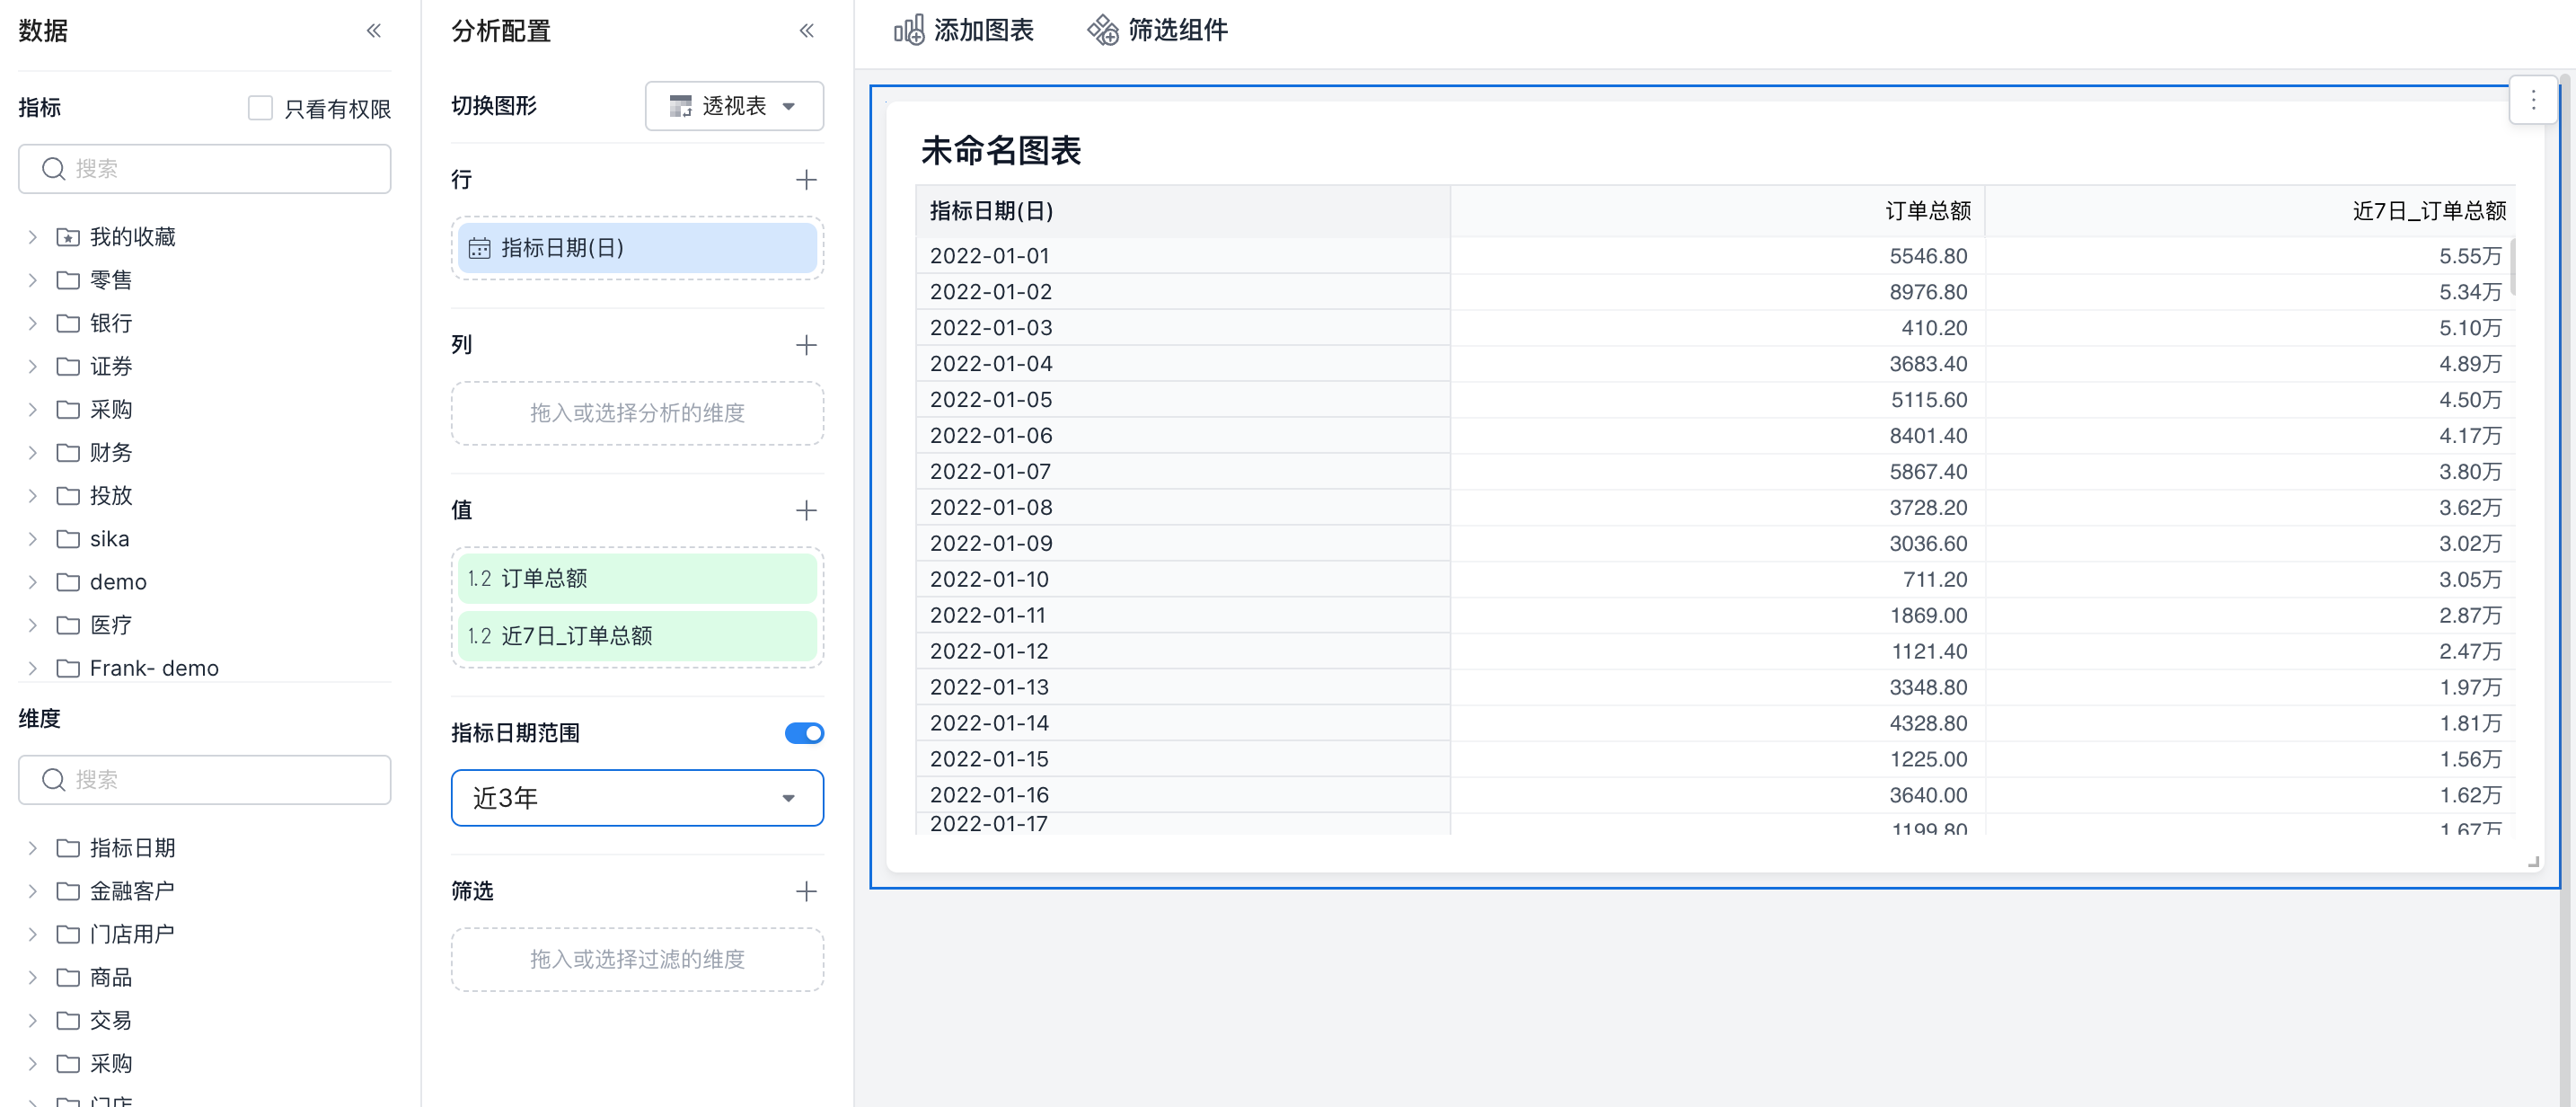
Select Pivot Table. Place metric date by day in rows, and place Total Order Amount and Total Order Amount in the Last 7 Days in values. Set the time range to Last 3 Years.
Then add the Country dimension to rows. Both metrics are now grouped and calculated by country.