View Alert Information
After monitoring alerts are configured, you can view an alert overview for all metrics on the Metric Monitoring management page, or select a specific metric to view alert details.
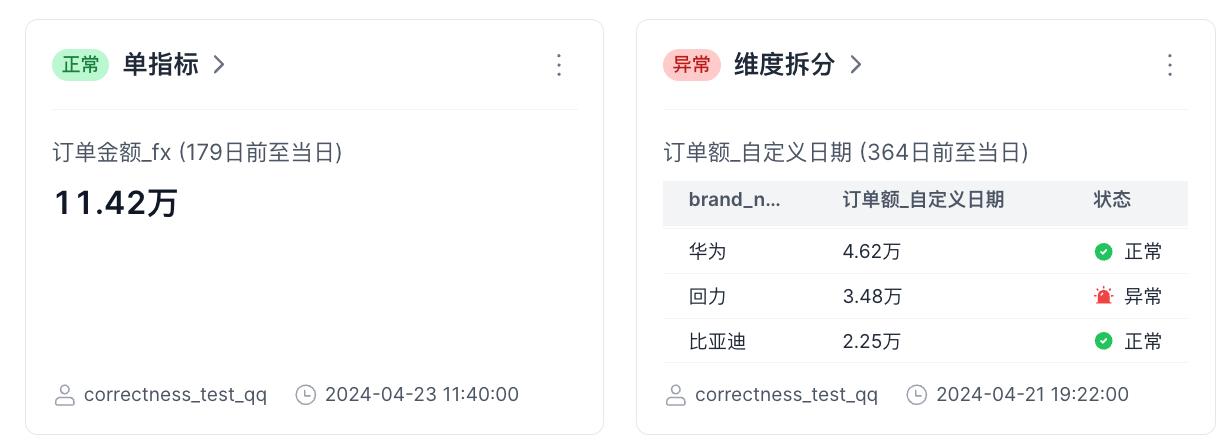
Card Preview
| Type | Description |
|---|---|
| Single metric | When an exception occurs, the card displays the metric information that triggered the alert. Prompt text: - Matched alert conditions: {rule 1}, {rule 2} |
| Dimension split | By default, dimension splits place abnormal items at the top of the list and then sort by larger metric values first. After the user manually sorts the list, the user-specified order is used. Hover over the abnormal icon to display the prompt text: - Matched alert conditions: {rule 1}, {rule 2} 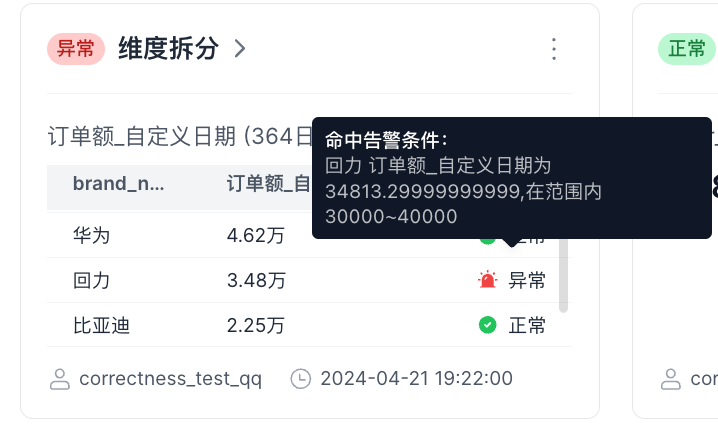 |
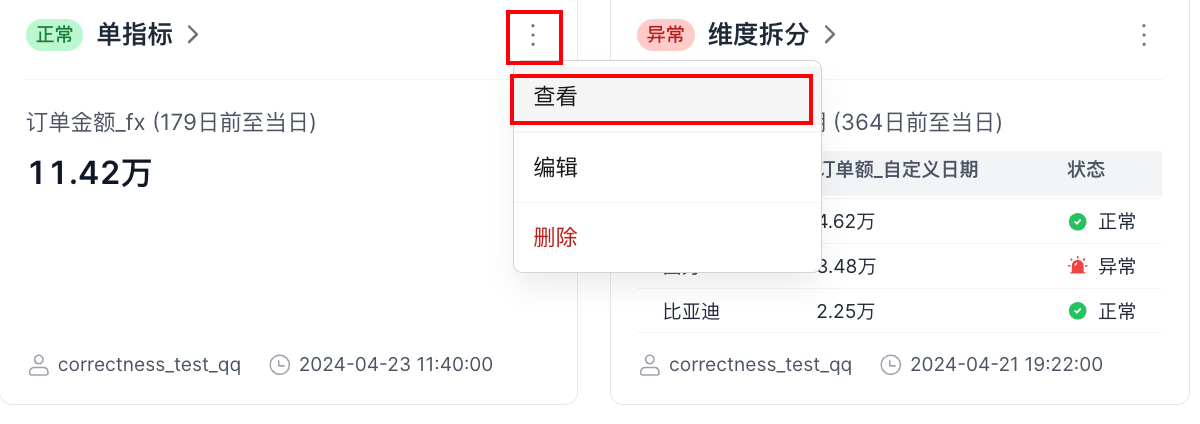
Monitoring Details
In the upper-right corner of the card preview, click the ... button and select View, as shown below.
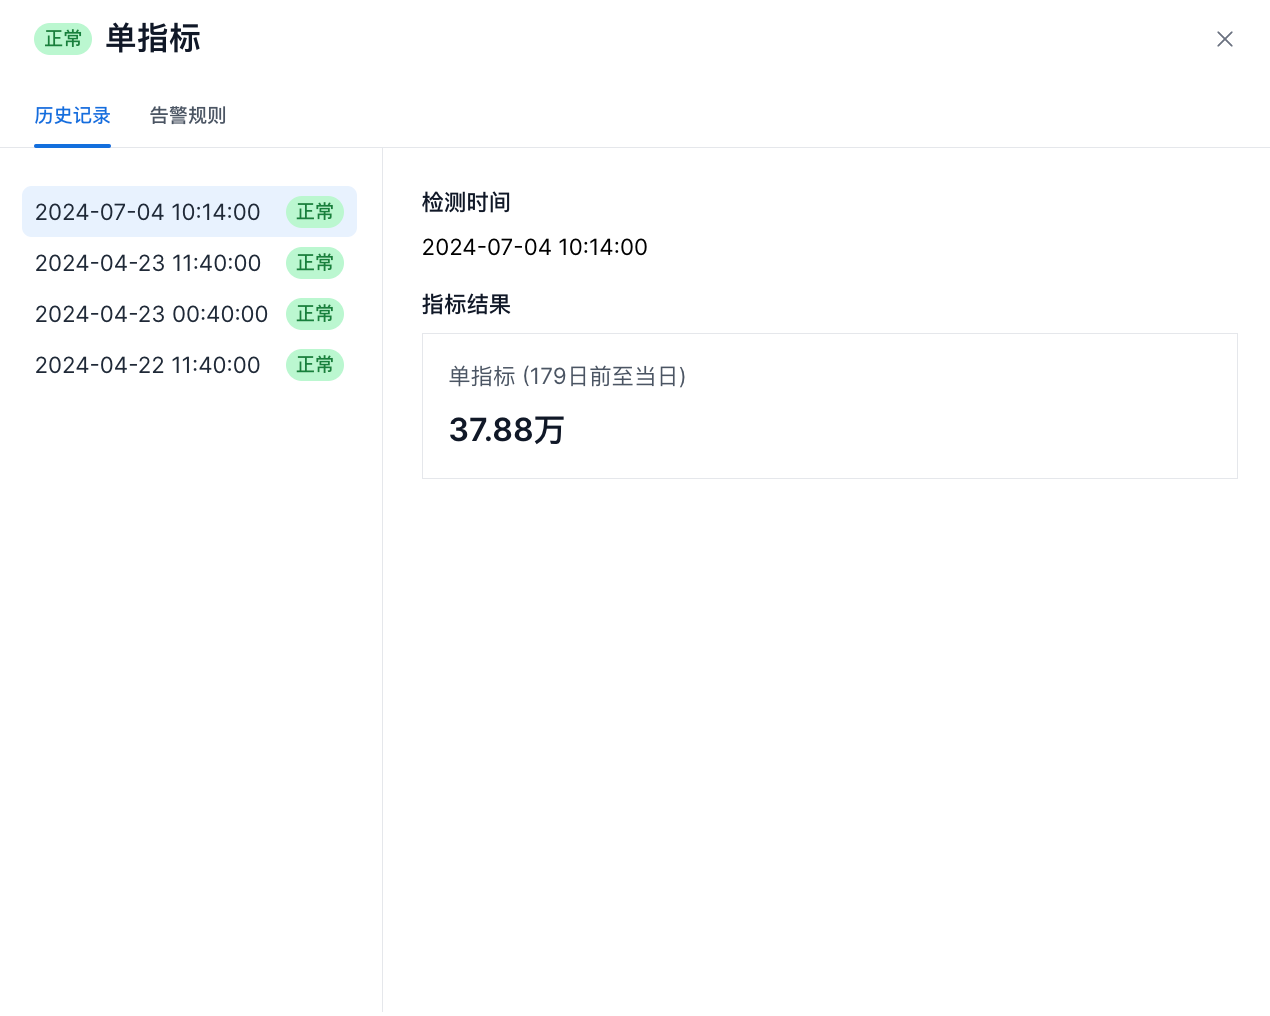
History
For single-metric details, the history displays each detection record. The page uses a left-right layout, with the detection snapshot information on the right.
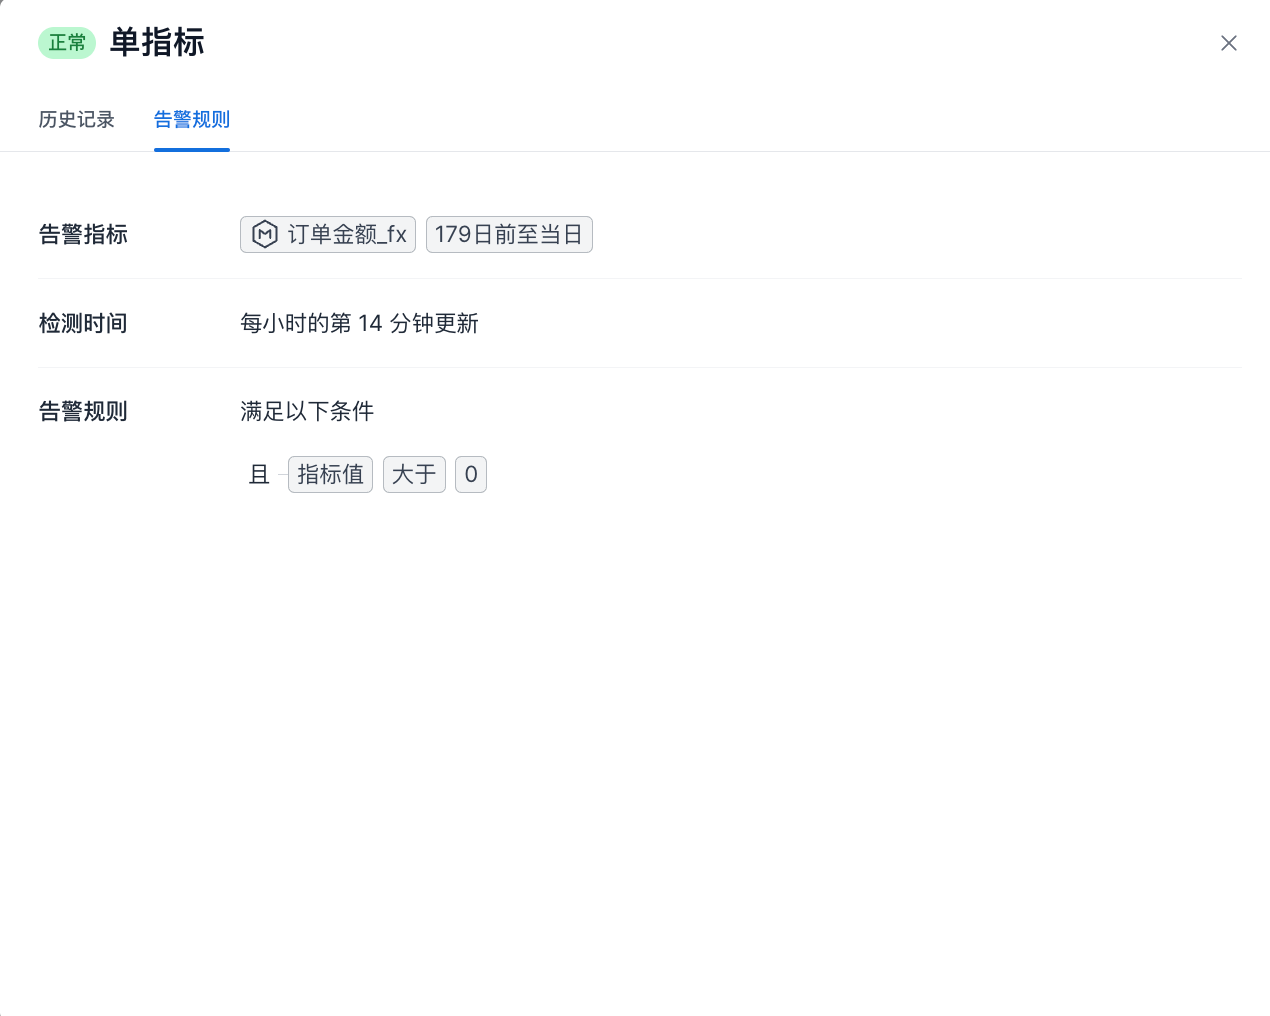
Alert Rules
Alert Rules displays the monitored metric, detection time, and alert rules.