Metric Attribution
1. Feature Introduction
Metric attribution analyzes why a metric changed and helps users answer questions such as:
-
Why did the metric increase or decrease?
-
Which dimensions or dimension values drove the change?
-
Compared with the comparison period, what were the main influencing factors in the current period?
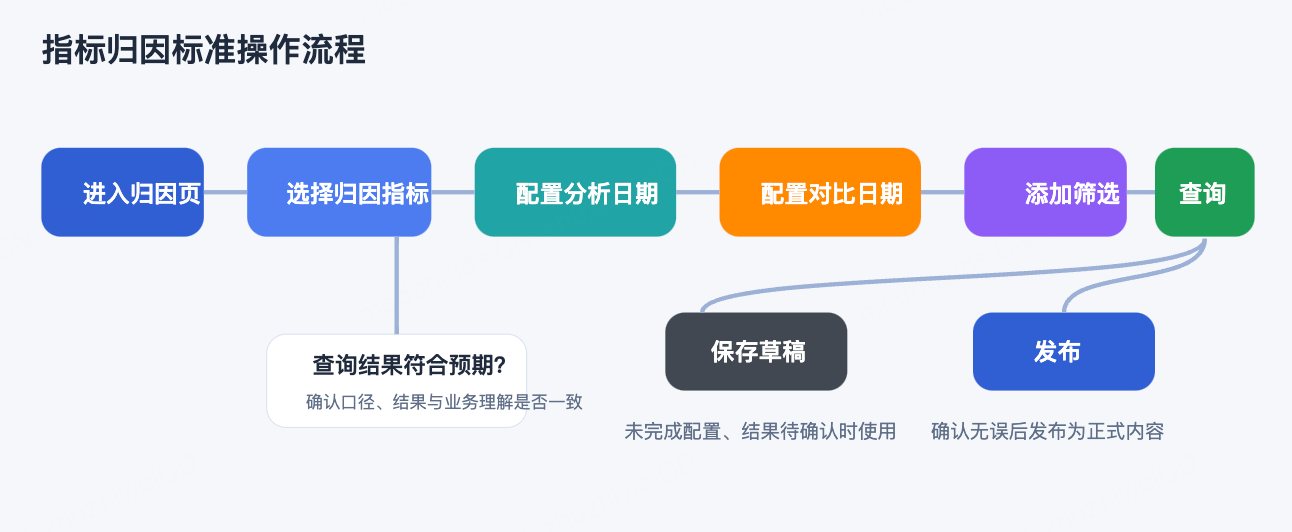
With metric attribution, users can configure the analysis date, comparison date, filters, and attribution dimensions around a target metric, view where the metric change came from, and identify the most important influencing factors.
2. Use Cases
Metric attribution is suitable for the following scenarios:
-
Analyze the sources of fluctuations in core metrics such as order volume, GMV, and registrations.
-
Determine whether a specific increase or decrease was mainly driven by a region, channel, product line, or customer segment.
-
Explain metric changes for reviews, reporting, and operational decisions.
-
Save a draft before publishing so that attribution settings can be adjusted repeatedly.
3. Page Entry
Based on the current page structure, metric attribution is located under Metric Applications and can be accessed from the left navigation.
Entry path:
-
Go to Metric Applications.
-
In the left navigation, select
Metric Attribution. -
Open the metric attribution list page.
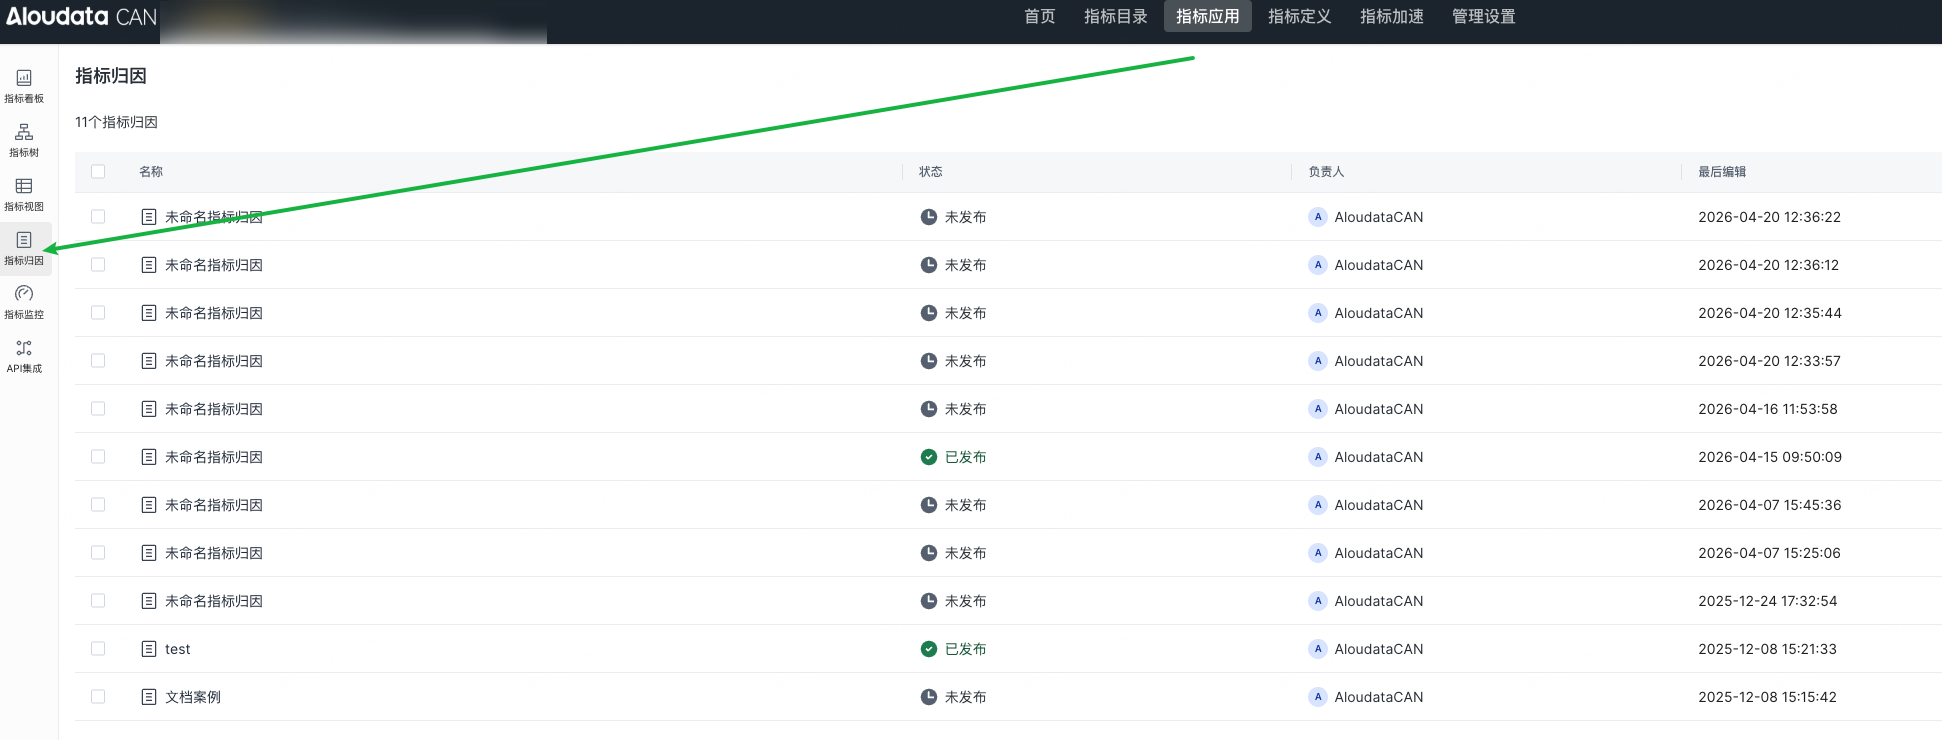
The left navigation shown in the screenshot includes:
-
Metric Dashboards
-
Metric Tree
-
Metric Views
-
Metric Attribution
-
Metric Monitoring
-
API Integration
4. List Page
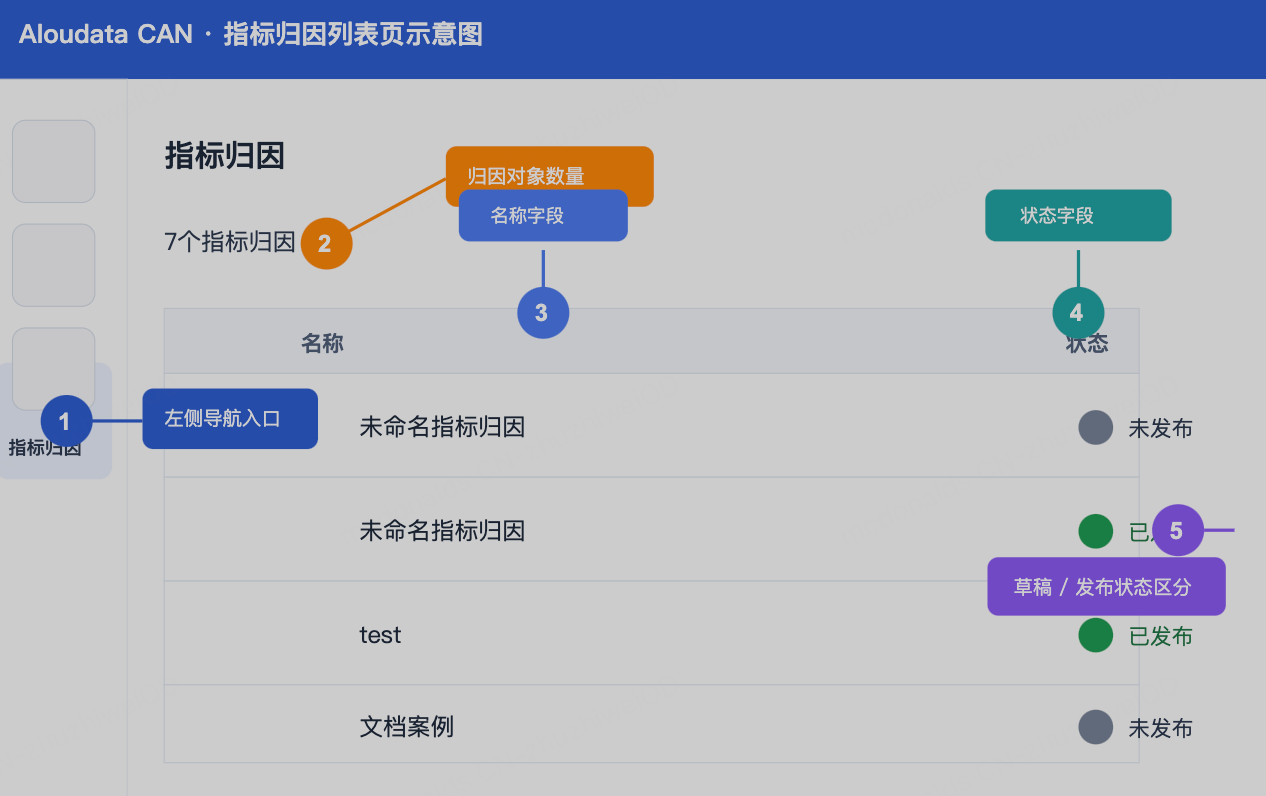
The list page is used to view existing metric attribution objects and distinguish drafts from published content.
Based on the screenshot, the list page includes the following information:
-
Page title:
Metric Attribution -
Quantity information, such as
7 metric attribution objects -
Table fields:
Name,Status -
Checkboxes: support multi-select
4.1 List Fields
-
Name: the name of the metric attribution object, such as "Unnamed Metric Attribution" or "Documentation Example".
-
Status: whether the current attribution object has been published.
4.2 Statuses
The screenshot shows two statuses:
-
Unpublished: the current content is still a draft or has not been officially published. -
Published: the current content has been published and can be used as an official configuration.
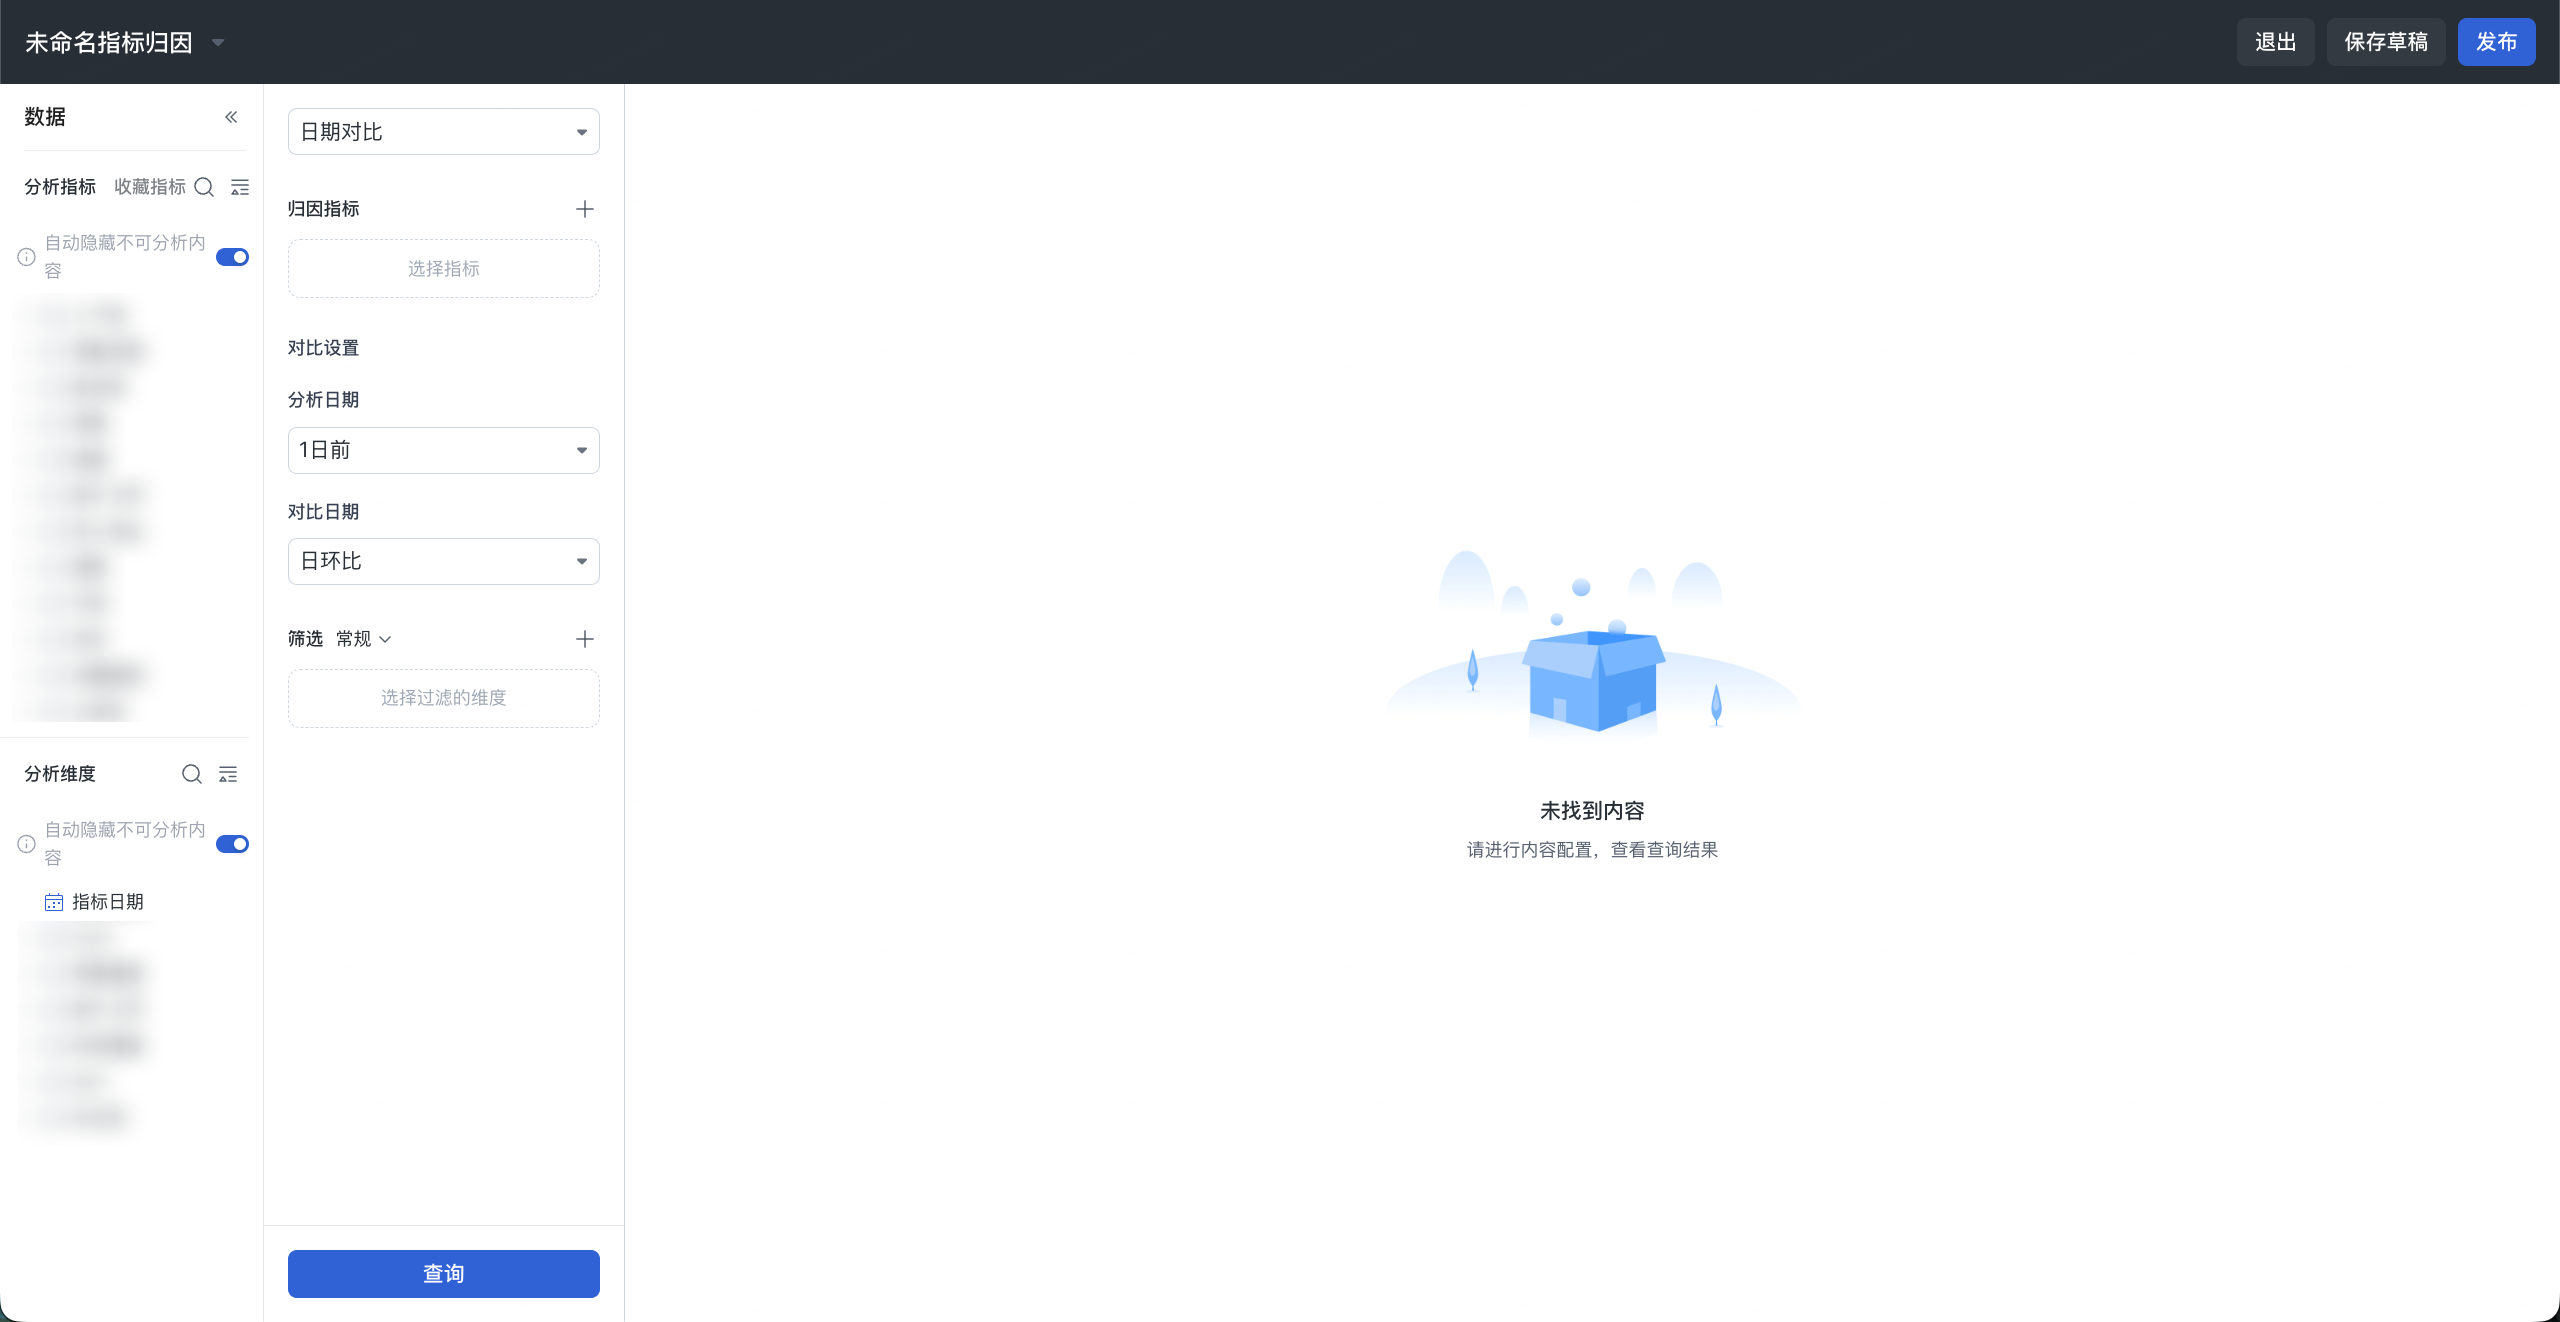
5. Editing Page Overview
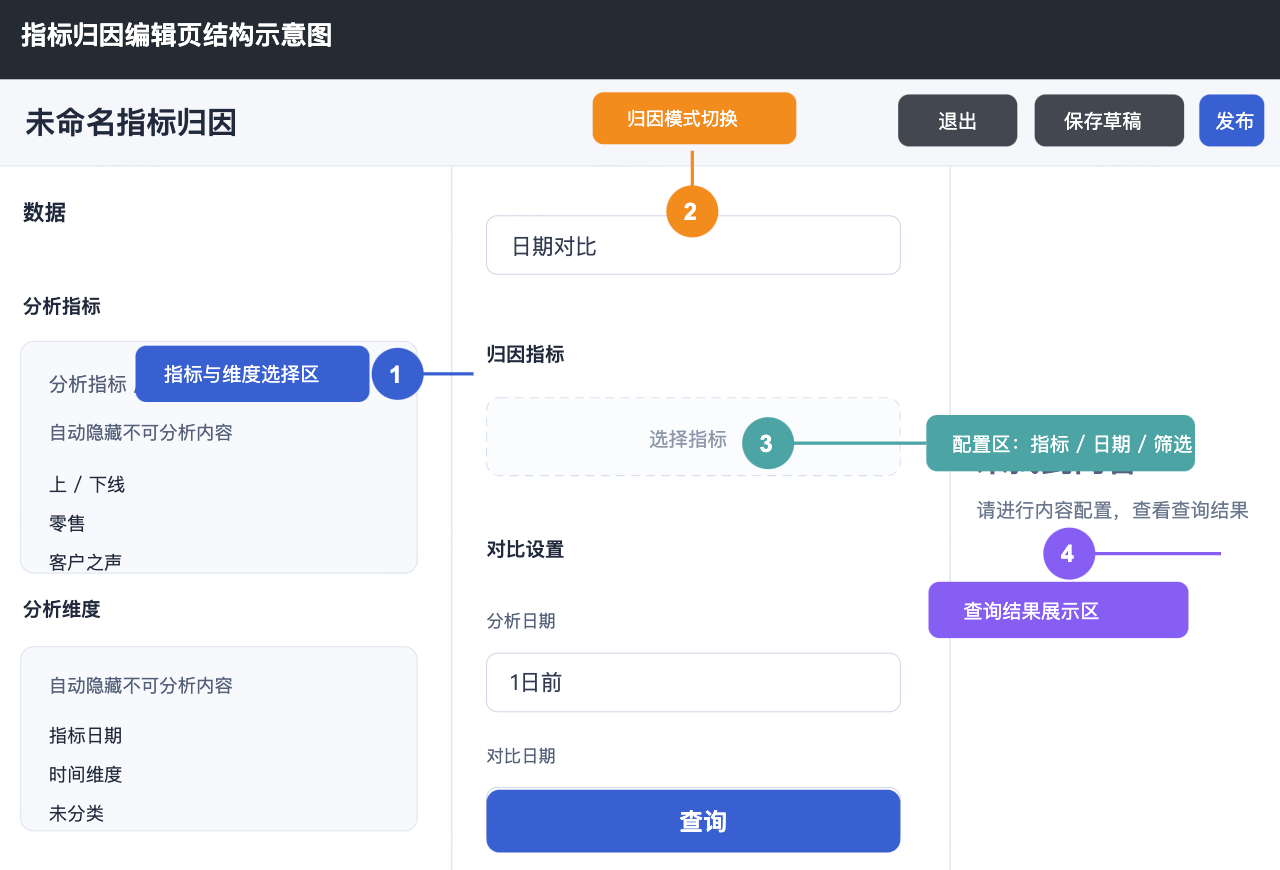
After you open a metric attribution object, the editing page appears. The editing page in the screenshot consists of four core areas:
-
Top action area
-
Left data selection area
-
Center configuration area
-
Right results area
6. Top Action Area
The top of the editing page contains the following elements:
-
Current attribution object name, such as
Unnamed Metric Attribution -
Drop-down entry next to the name
-
Exit: leave the current editing page -
Save Draft: save the current configuration without publishing it -
Publish: publish the current configuration as official content
7. Left Data Selection Area
The left area is titled Data and is mainly used to select the analysis metric and analysis dimensions.
7.1 Analysis Metric Area
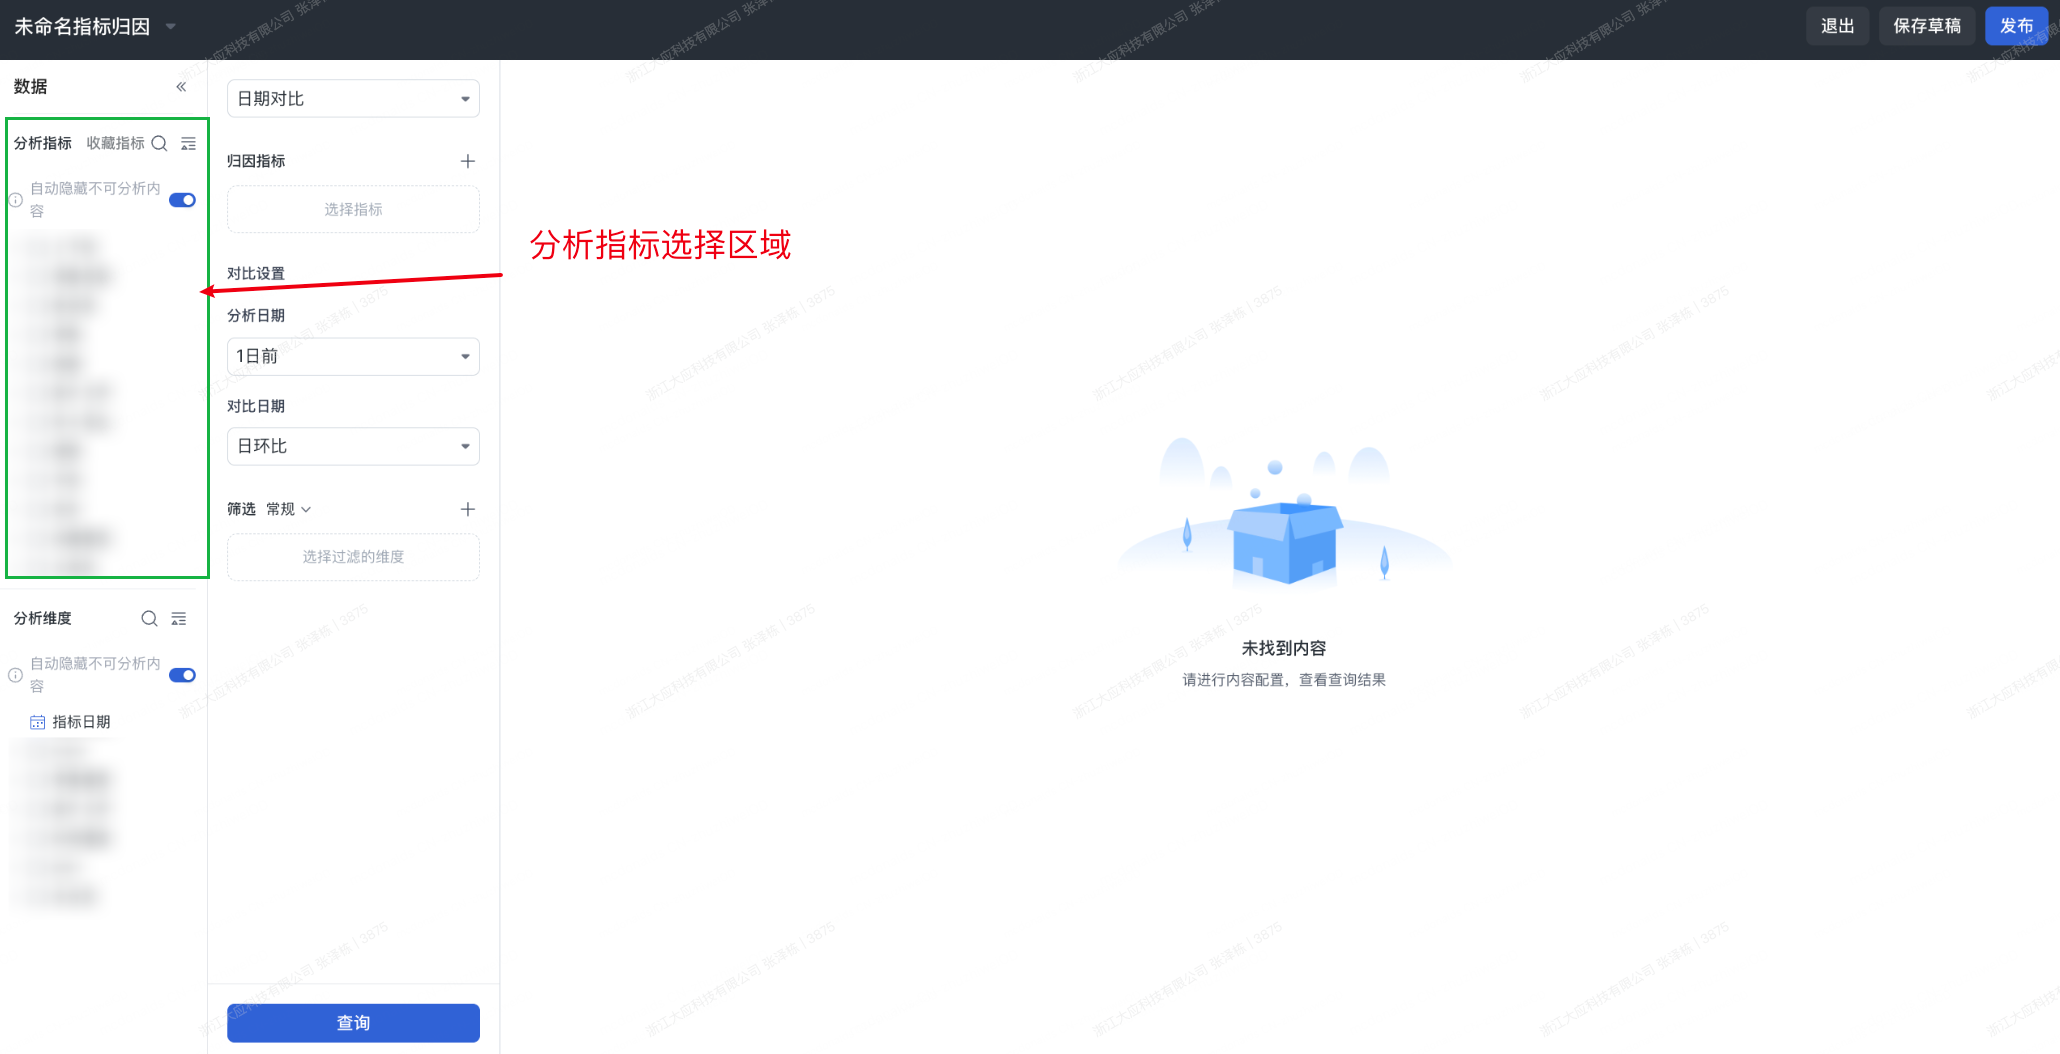
The analysis metric area includes:
-
Tabs:
Analysis Metrics,Favorite Metrics -
Search entry
-
Display mode or sorting entry
-
Switch:
Automatically Hide Unanalyzable Content -
Metric catalog tree
Description:
-
Analysis Metrics: view the analysis metrics currently available for selection. -
Favorite Metrics: quickly access favorite metrics. -
Automatically Hide Unanalyzable Content: after this option is enabled, invalid selections are reduced and metrics that can be used for attribution analysis are shown first.
7.2 Analysis Dimension Area
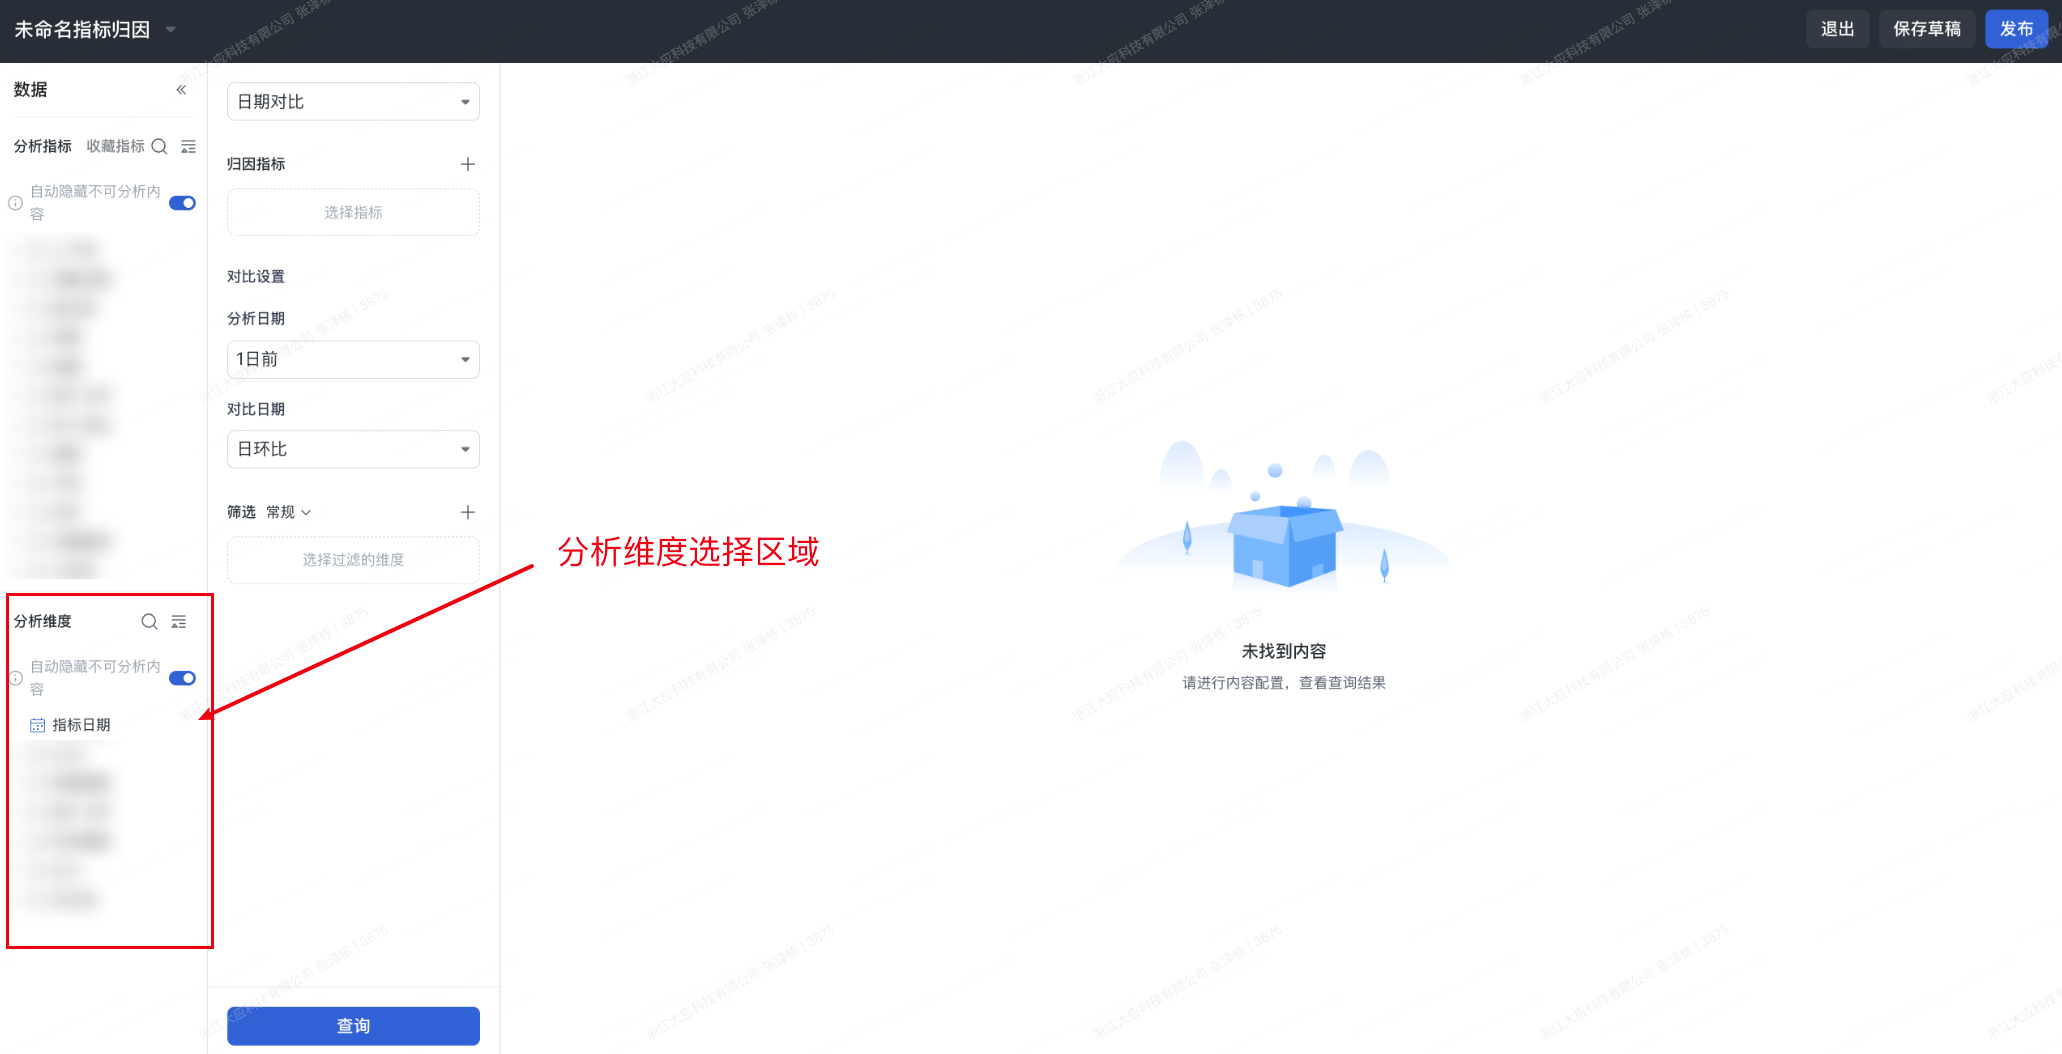
The analysis dimension area is in the lower-left part of the page and includes:
-
Search entry
-
Display mode or sorting entry
-
Switch:
Automatically Hide Unanalyzable Content -
Dimension catalog tree
Description:
-
Analysis dimensions define the perspectives used for attribution breakdown.
-
Users can select dimensions from the dimension tree for attribution analysis or filtering.
8. Center Configuration Area
The center area is the core configuration area for metric attribution. Based on the current screenshot, attribution mode includes at least two options:
-
Date Comparison -
Peer Comparison
Fields in the center configuration area differ by mode. The currently identifiable configuration items include:
-
Attribution mode drop-down: currently displayed as
Date ComparisonorPeer Comparison -
Attribution Metric -
Comparison Settings -
Analysis Date/Comparison Date -
Analysis Category/Analysis Object/Comparison Object -
Filters -
Metric Date Range -
Query
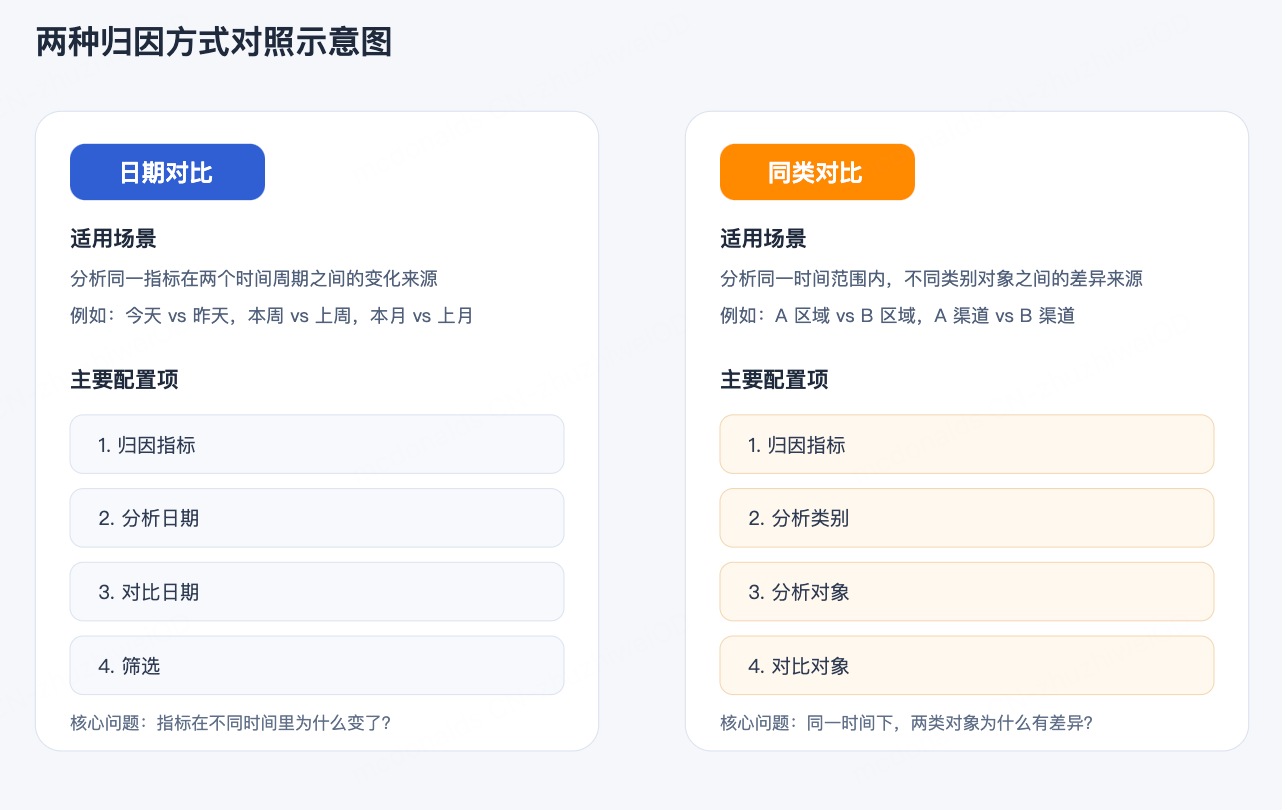
8.1 Attribution Mode
The top drop-down is used to switch attribution methods. Based on the current page, at least the following two modes are supported:
8.1.1 Date Comparison
Date comparison analyzes the source of changes in the same metric between two time periods.
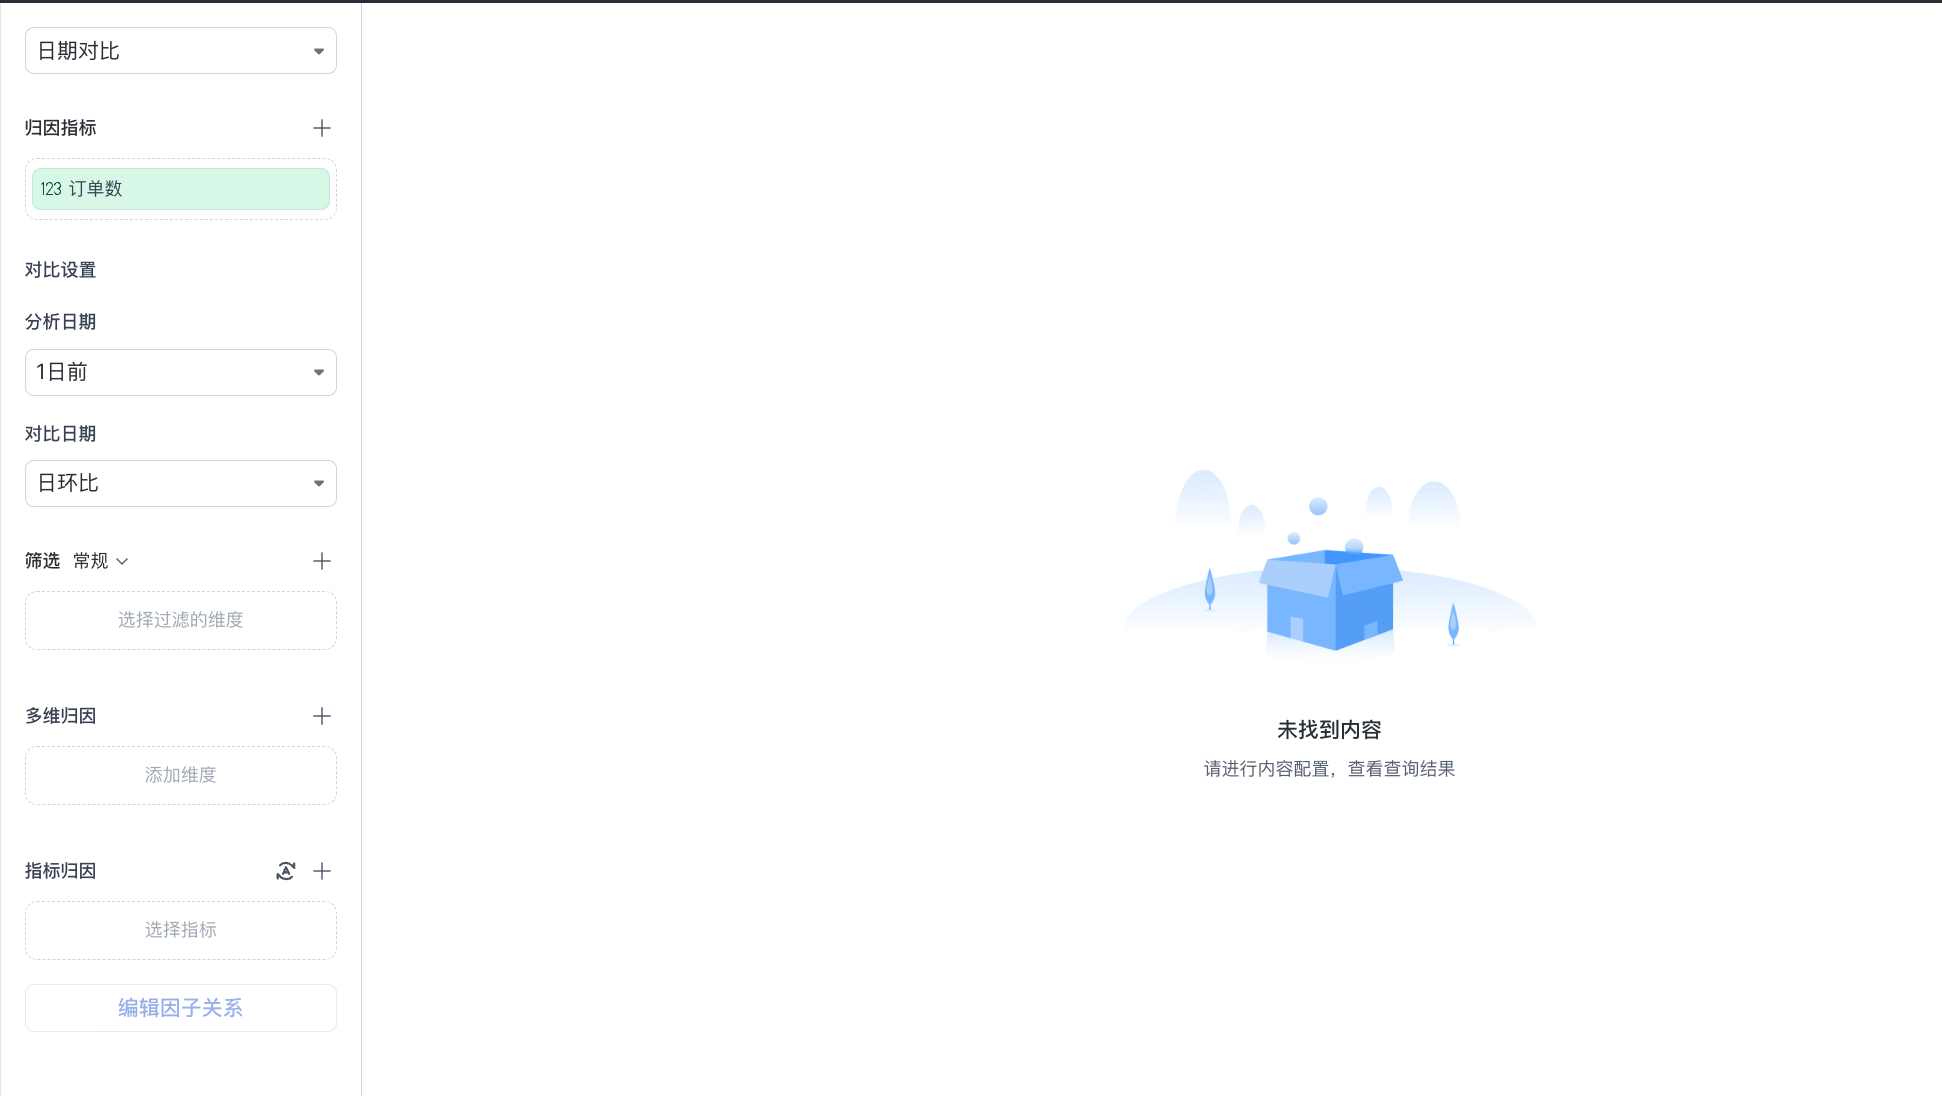
The main configuration items visible in the screenshot include:
-
Attribution Metric -
Analysis Date -
Comparison Date -
Filters
Example use cases:
-
Why did today's order volume change compared with yesterday?
-
Why did this week's GMV change compared with last week?
-
Why did this month's registrations change compared with last month?
The core logic of date comparison is:
-
First determine an analysis period.
-
Then determine a comparison period.
-
The system performs attribution based on the metric difference between the two periods.
8.1.2 Peer Comparison
Peer comparison analyzes the source of differences between category objects within the same time range.
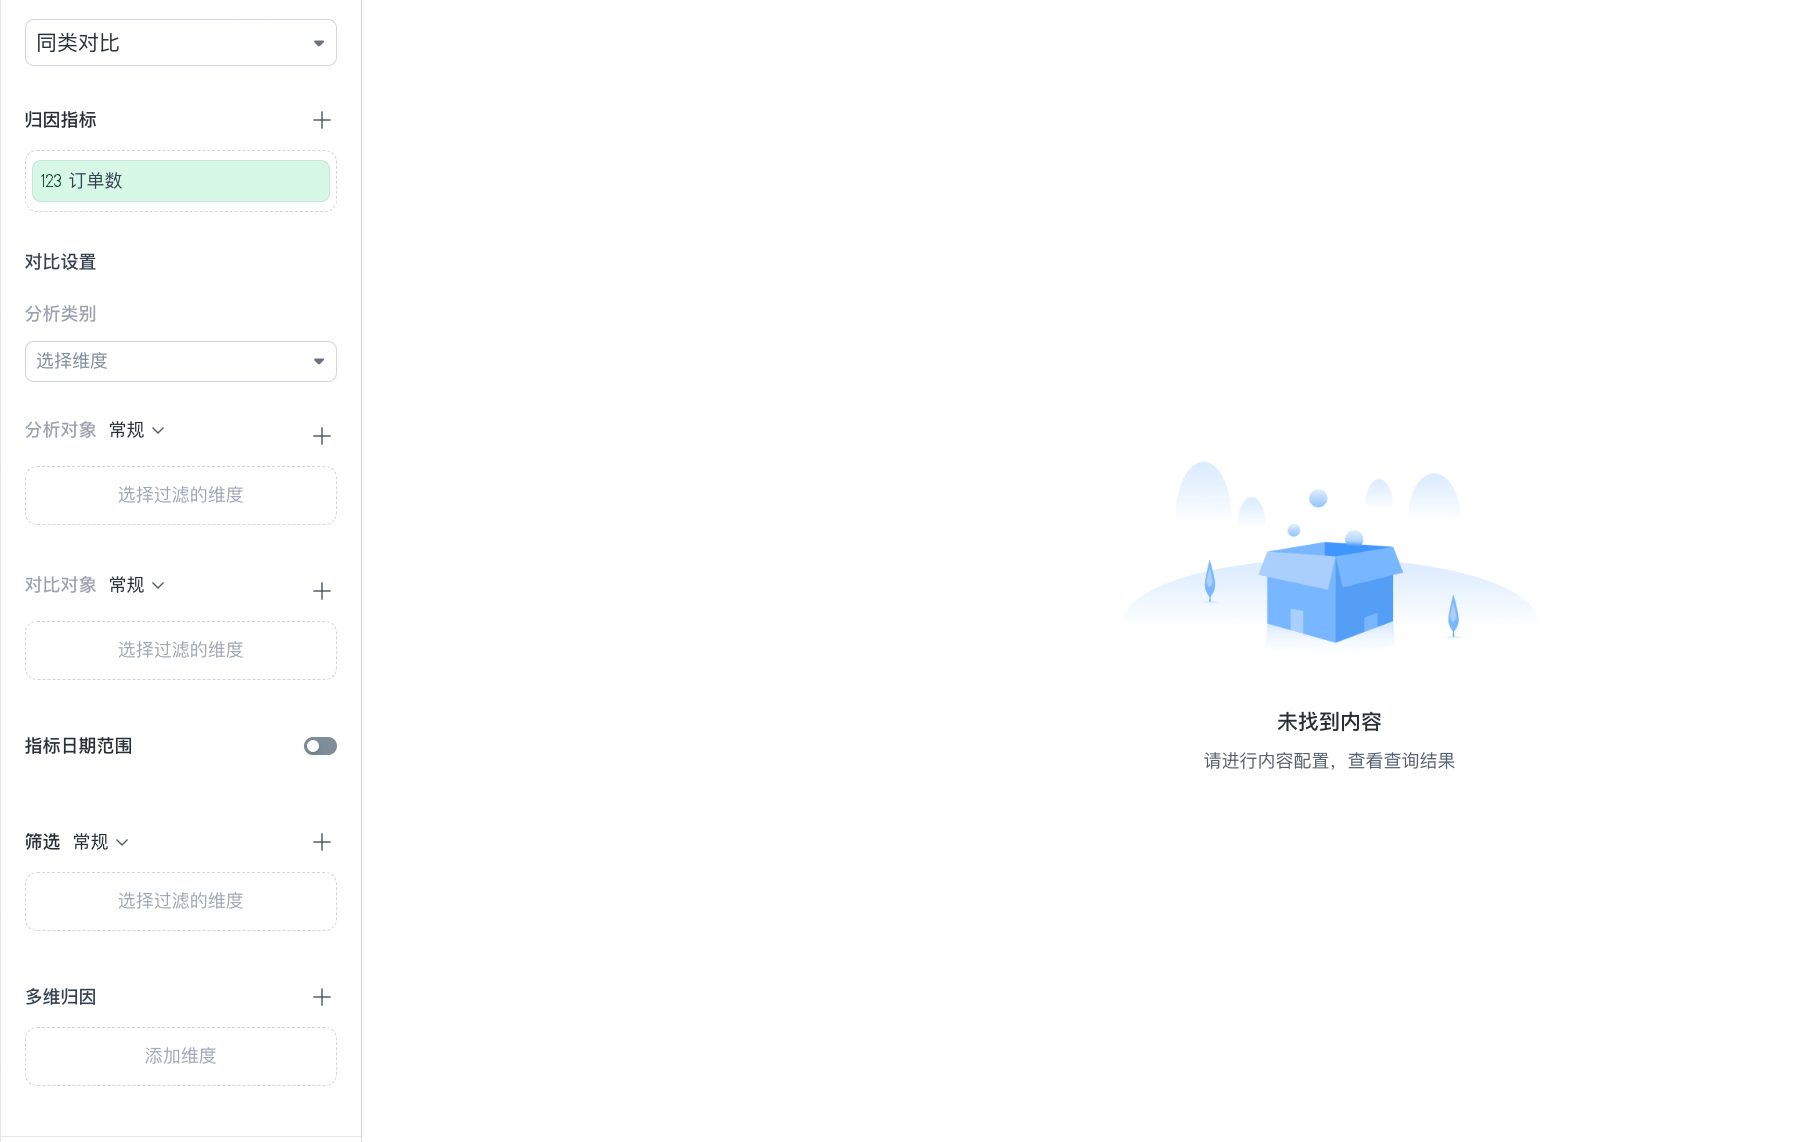
The main configuration items visible in the screenshot include:
-
Attribution Metric -
Analysis Category -
Analysis Object -
Comparison Object -
Metric Date Range
Example use cases:
-
What caused the metric difference between East China and South China?
-
What caused the metric difference between the self-operated channel and the agency channel?
-
What factors explain the difference between customer group A and customer group B within the same time range?
The core logic of peer comparison is:
-
First select an analysis dimension as the category.
-
Then specify the analysis object and comparison object.
-
The system performs attribution on the difference between the two object groups under the same metric definition and time range.
8.1.3 Choosing a Mode
-
To answer "Why did this metric change compared with the previous period?", select
Date Comparison. -
To answer "Why are two objects different within the same time period?", select
Peer Comparison.
8.2 Attribution Metric
The Attribution Metric area is used to select the core metric for attribution analysis.
The screenshot shows:
-
Title:
Attribution Metric -
Plus sign on the right: used to add or select a metric
-
Placeholder:
Select Metric
Description:
-
The attribution metric is the target of the current analysis.
-
If no attribution metric is selected, no valid query result can be obtained.
8.3 Comparison Settings
The Comparison Settings area changes with the attribution mode.
8.3.1 Comparison Settings in Date Comparison Mode
The screenshot shows two configuration items:
-
Analysis Date: the selected value in the example is1 day ago. -
Comparison Date: the selected value in the example isday-over-day.
Description:
-
Analysis date: defines the target date or time range for the analysis.
-
Comparison date: defines the reference period to compare with the target date.
Based on system capabilities, comparison methods usually support day, week, month, quarter, year, or custom comparison.
8.3.2 Comparison Settings in Peer Comparison Mode
In peer comparison mode, the screenshot shows the following configuration items:
-
Analysis Category: the current placeholder isSelect Dimension. -
Analysis Object: supports selecting filtered dimensions by category. -
Comparison Object: supports selecting filtered dimensions by category. -
Metric Date Range: includes a switch on the right.
Description:
-
Analysis category: specifies "what category to compare by", such as region, channel, store, or customer group.
-
Analysis object: defines the first object range to analyze.
-
Comparison object: defines the other object range to compare against.
-
Metric date range: controls whether the metric date range is limited.
8.4 Filters
The Filters area is used to set filter conditions for attribution analysis.
The screenshot shows:
-
Filter title:
Filters -
Current category:
General -
Drop-down entry
-
Plus sign on the right
-
Placeholder:
Select Dimension to Filter
Description:
-
Filters limit the business scope of attribution analysis.
-
Users can configure filter conditions based on dimensions, such as analyzing only a specific business line, region, product, or organization.
8.5 Query
The primary button at the bottom is Query.
After you click Query, the system performs attribution calculation based on the current configuration and displays the query result in the results area on the right.
9. Results Area
The right area displays attribution results.
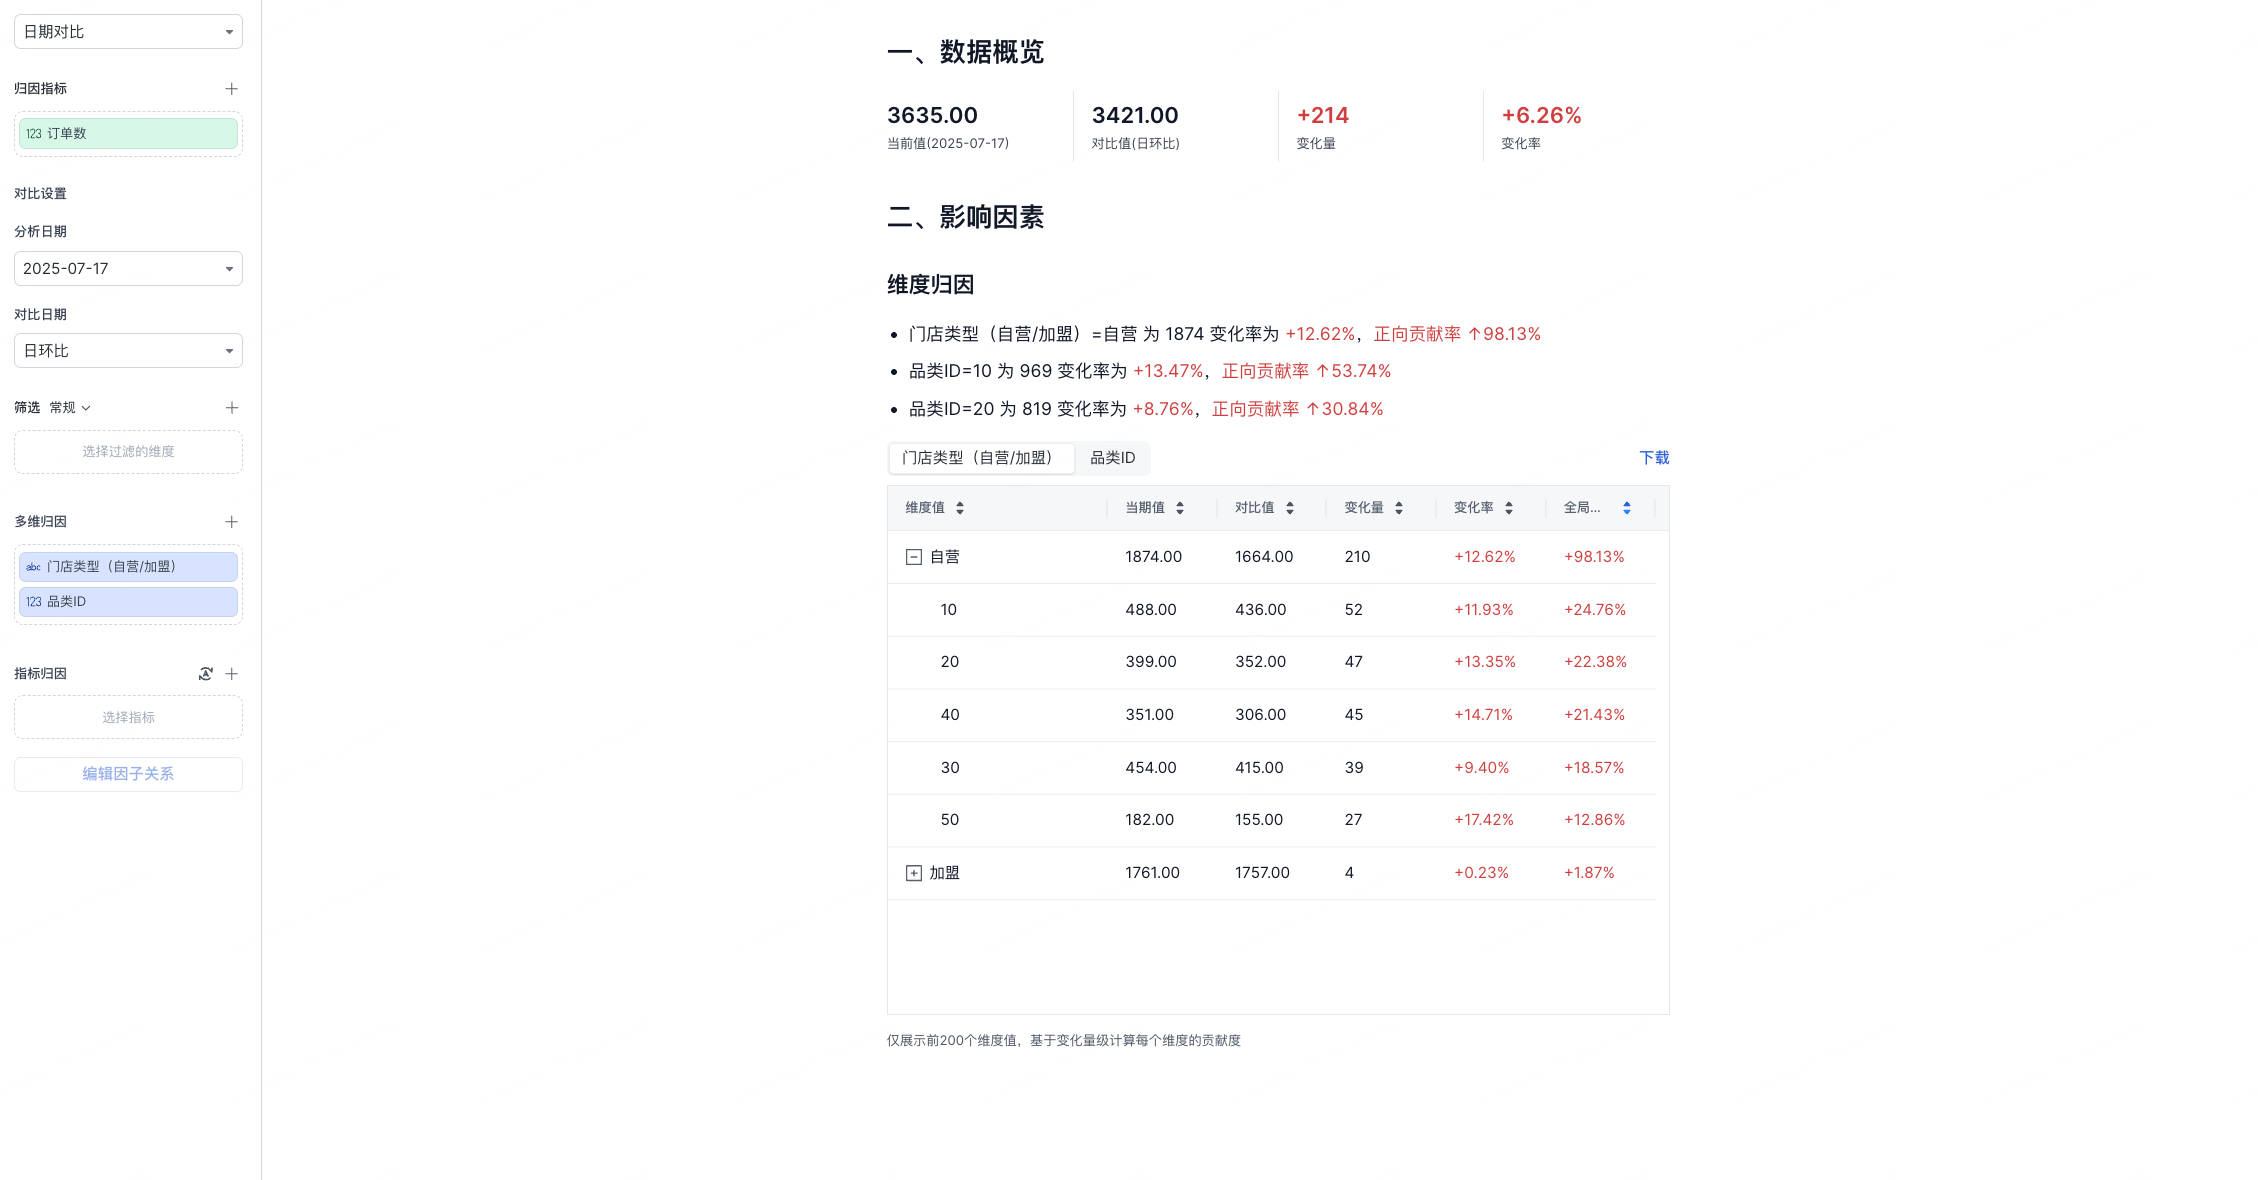
10. Result Definitions
Although the current screenshot does not show a result table, attribution results typically include the following fields.
10.1 Current Value
The metric or dimension value result in the current analysis period.
10.2 Comparison Value
The metric or dimension value result in the comparison period.
10.3 Growth Value
Calculation:
10.4 Growth Rate
Calculation:
10.5 Contribution Rate
The contribution percentage of a dimension value to the overall metric change.
It can be understood as:
When the result page displays dimension value details, users can focus on:
-
Which dimension values have the highest contribution rate.
-
Which dimension values have a negative contribution rate.
-
Which dimension values are growing quickly but have a small volume.
-
Which dimension values have a large volume and are the main source of the overall change.