Real-Time Metric Querying
Overview
Users can query metric results at minute-level granularity in the metric platform. This article explains how to use the metric platform to query data for the following three scenarios:
- Query today's sales amount so far, and use a metric card to show the current value and year-over-year growth rate
- Show today's order volume by 30-minute interval, along with the same-period comparison value
- Show today's cumulative sales amount trend at 5-minute intervals

Instructions
Prerequisites
- The date field in the dataset must use the DATETIME data type. When configuring the base metric in the metric platform, select this date field as the metric date identifier.
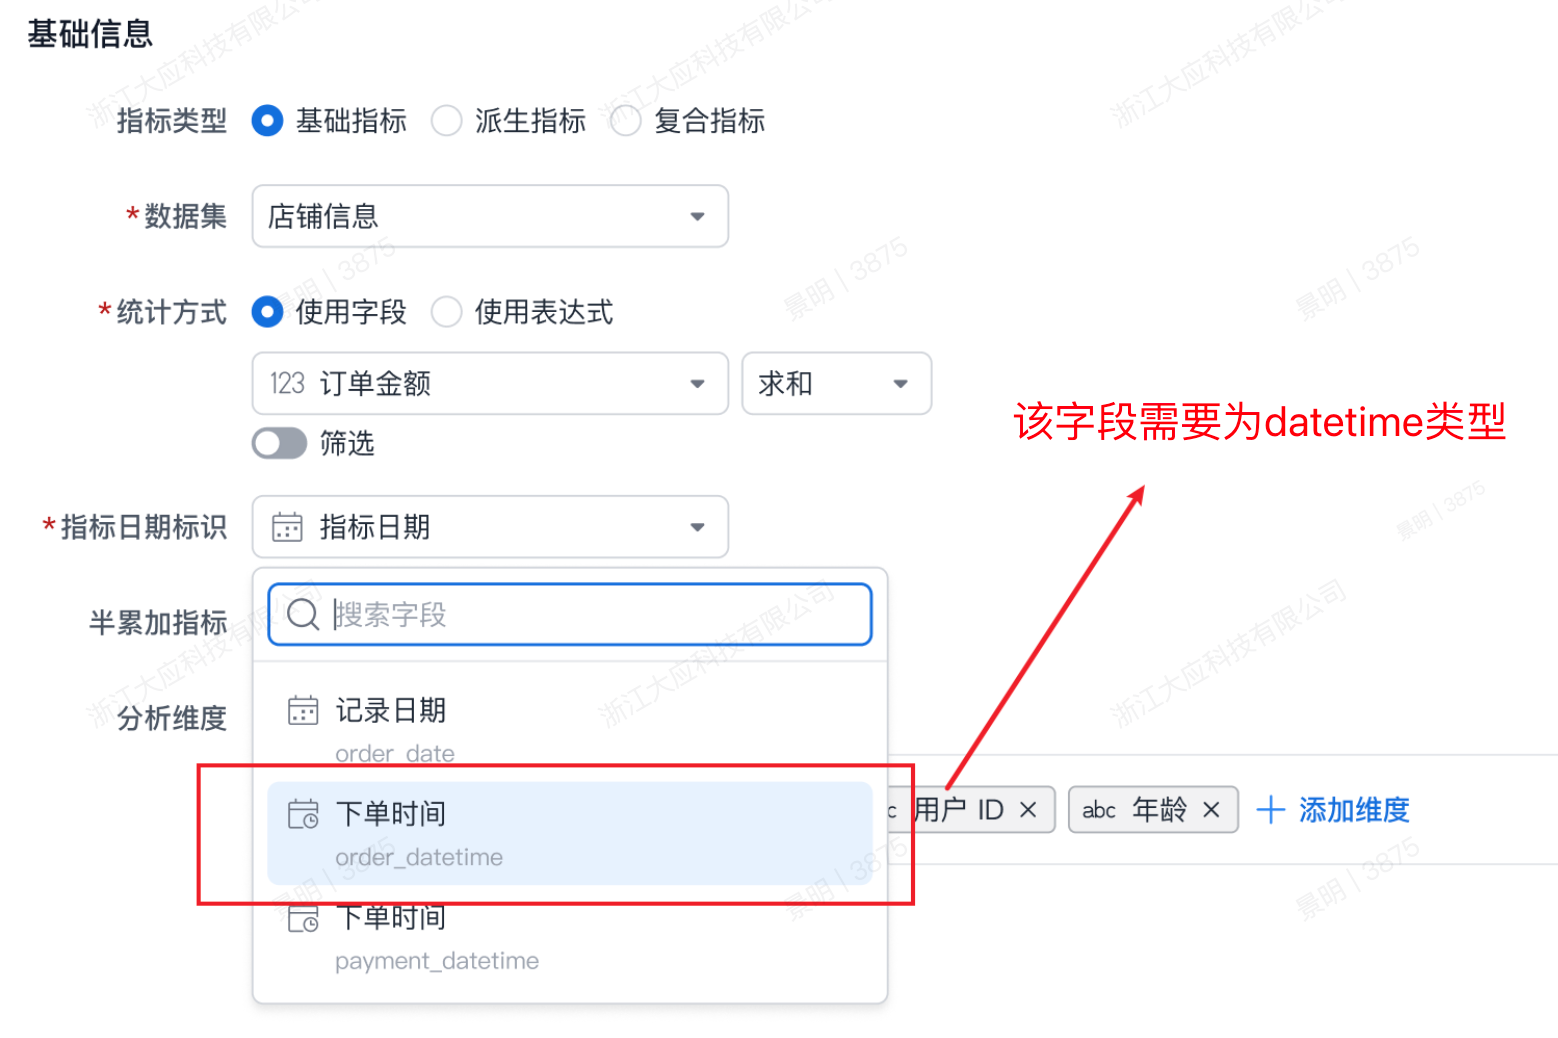
- Configure the base metric
Sales Amount (Sales_Amount).
Query Configuration
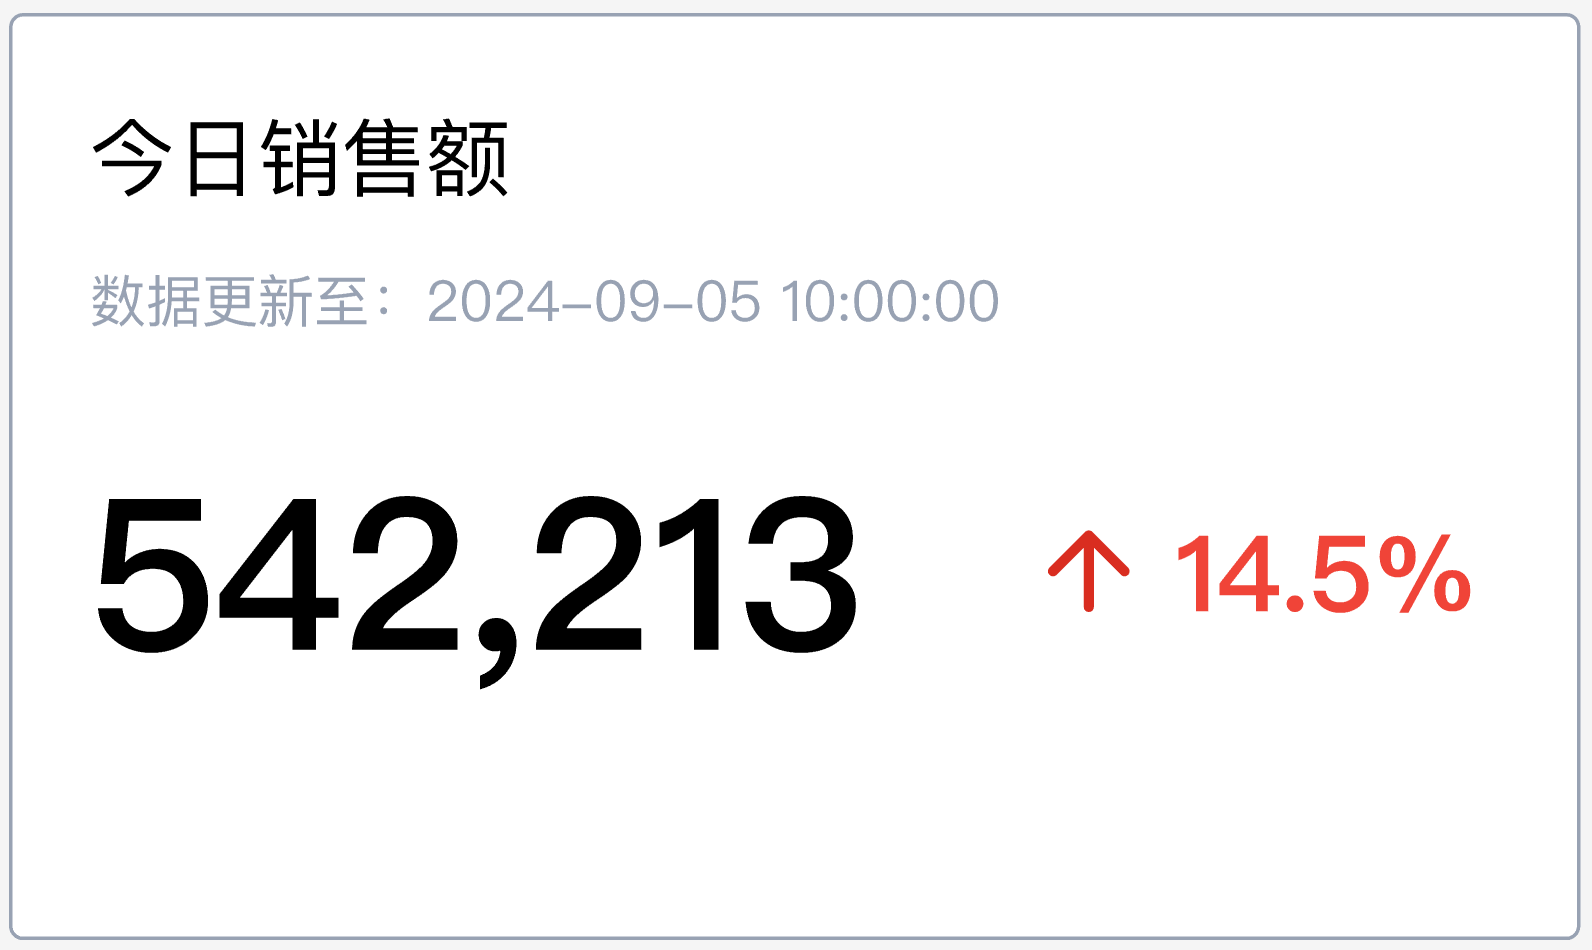
Today's Sales Amount
Show the cumulative value of today's sales amount up to the current time, along with the year-over-year growth rate for the corresponding period 52 weeks earlier.
{
  "metrics":[
    "Sales_Amount",
    "Sales_Amount__sameperiod__-52_wow__growth" // Note 1
  ],
  "dimensions": [ ],
  "timeConstraint": "[metric_time__minute]>=dateTrunc(now(),\"DAY\") and [metric_time__minute]<=dateTrunc(now(),\"minute\")" // Note 2
  }
}
-
Note 1: Sales_Amount__sameperiod__-52_wow__growth
- Quickly returns the metric's year-over-year growth rate compared with 52 weeks earlier.
-
Note 2: [metric_time__minute]>=dateTrunc(now(),\"DAY\") and [metric_time__minute]<=dateTrunc(now(),\"minute\")
- Queries data where the date is today and the time is earlier than or equal to the current time.
Note: If you filter only by TODAY( ), the data range used to calculate values from 52 weeks earlier will be expanded.
If you filter only by TODAY( ), the data range used to calculate values from 52 weeks earlier will be expanded.
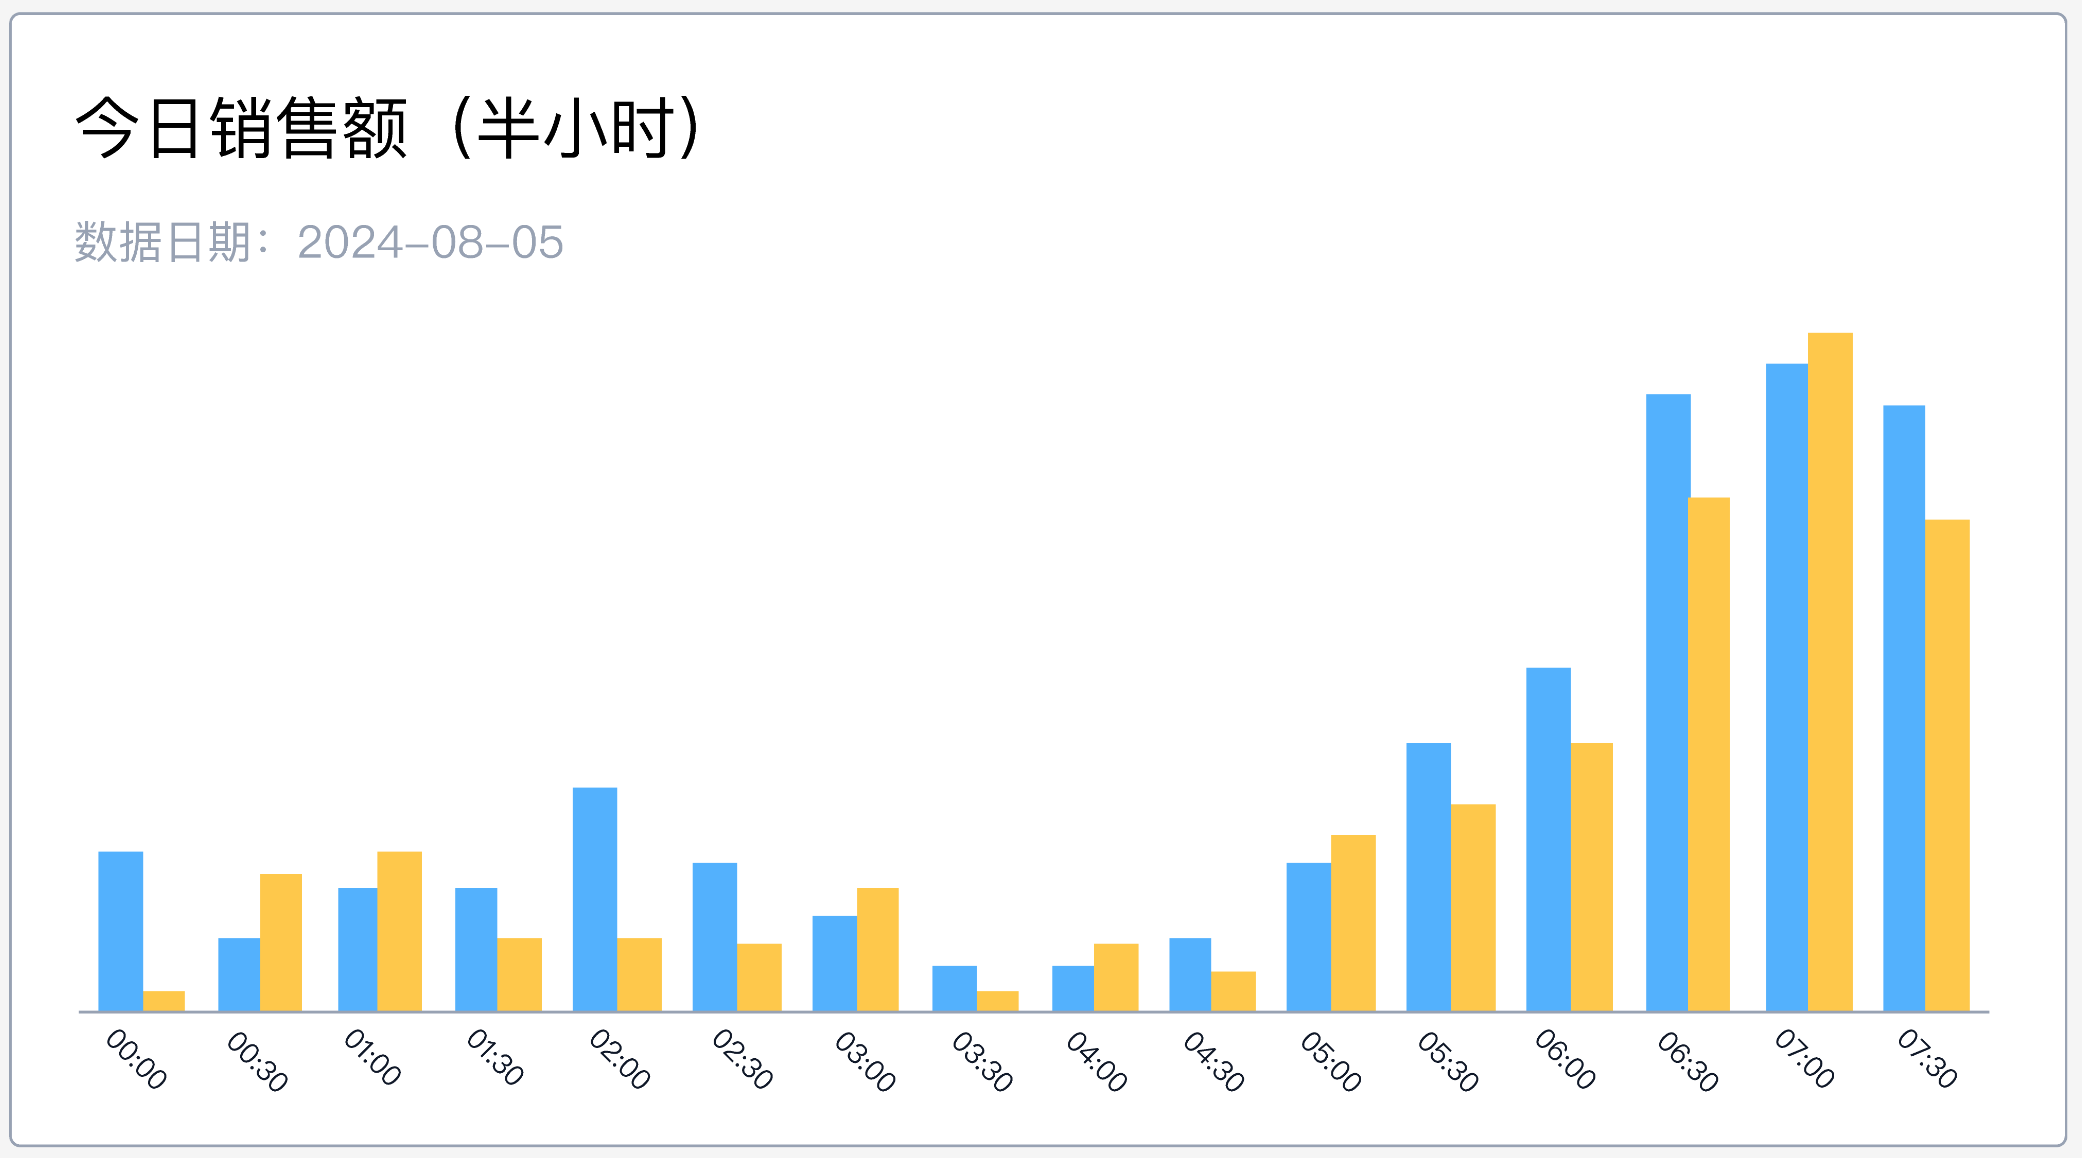
Today's Sales Amount Distribution
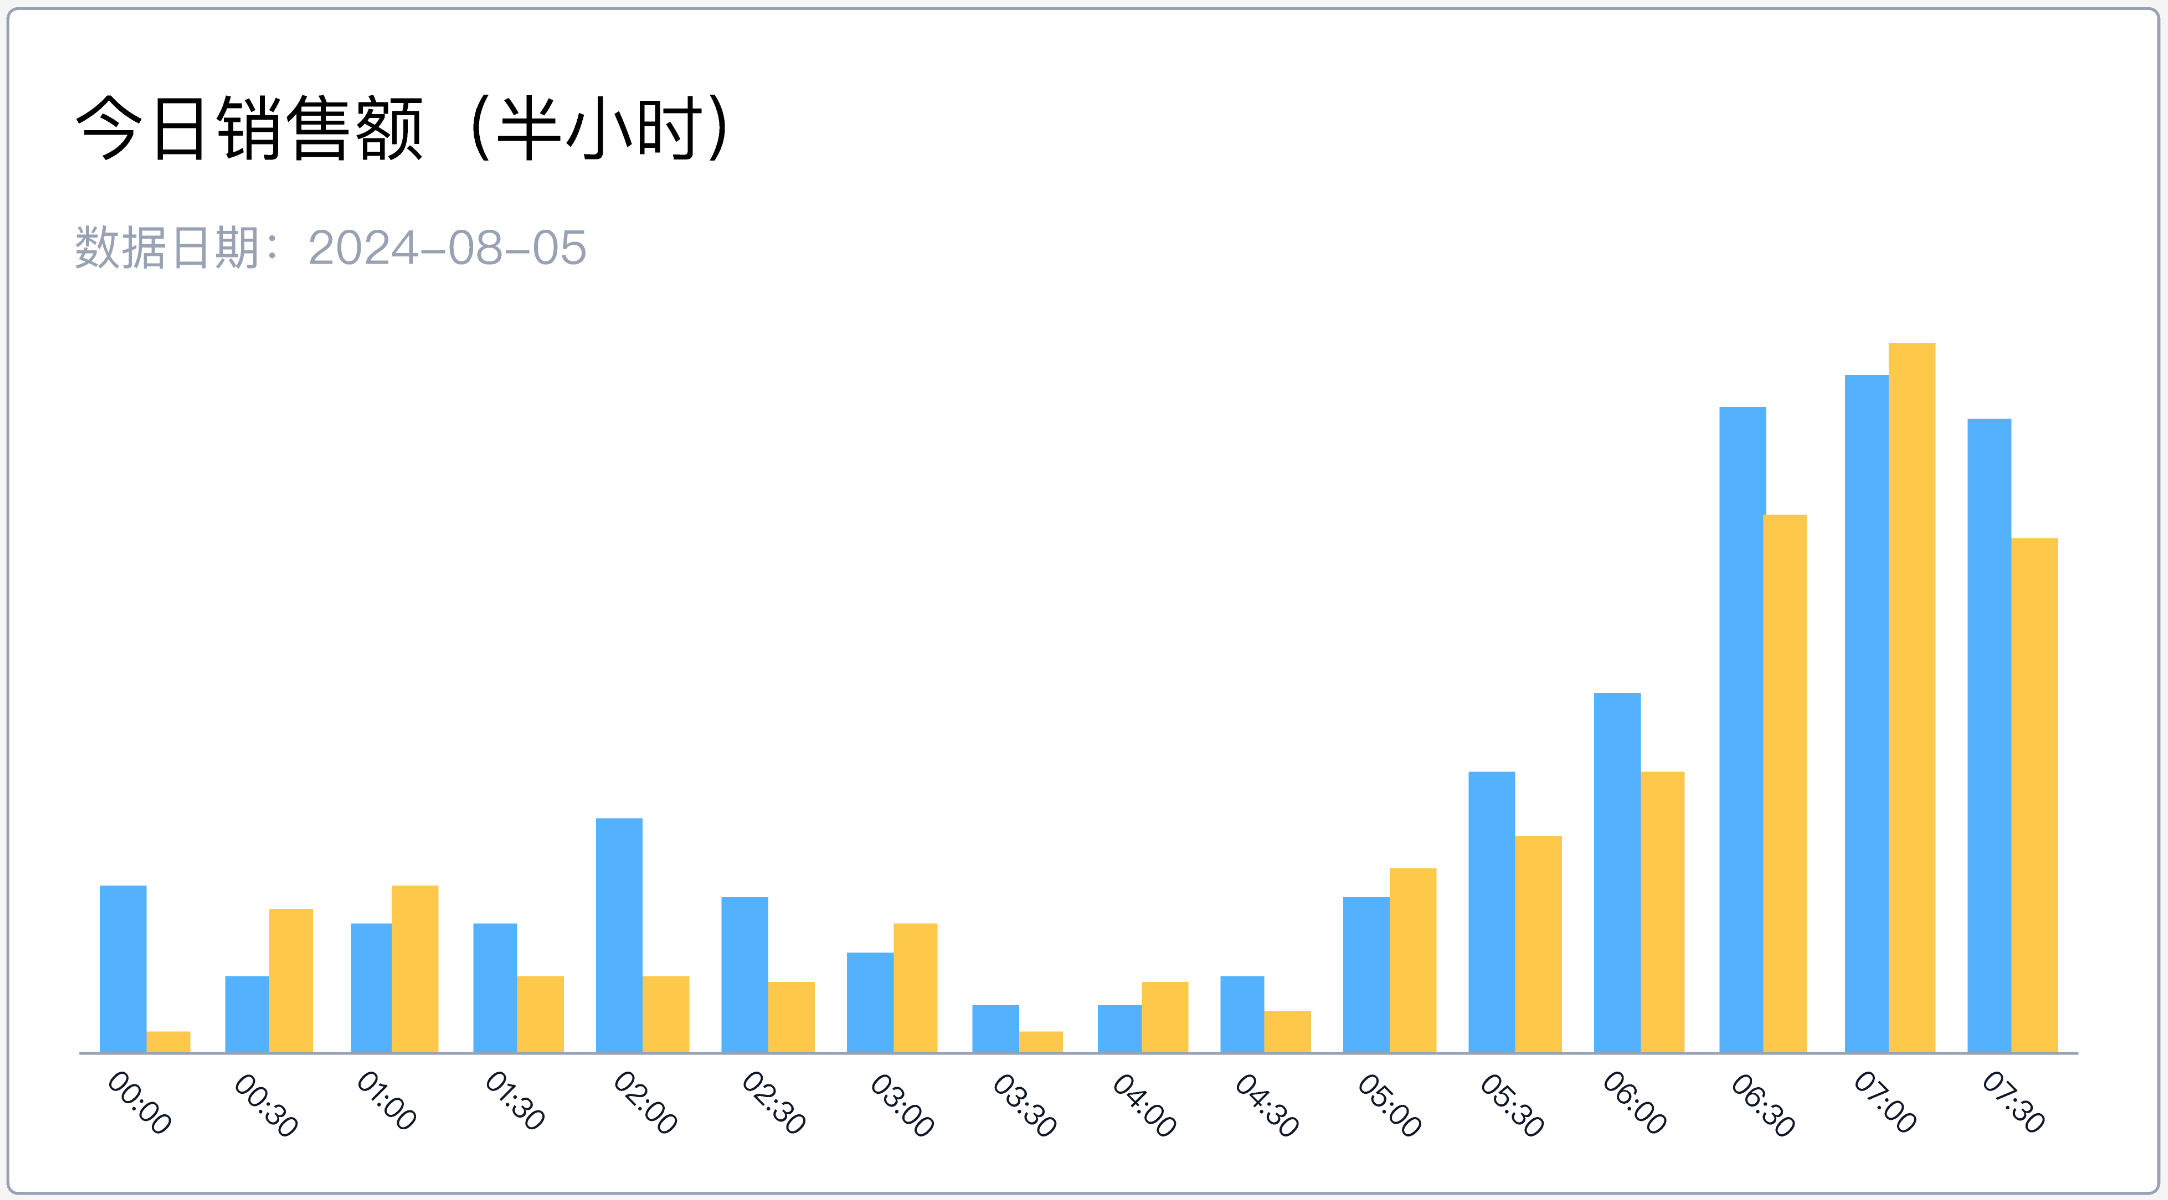
Show a column chart with one data point every 30 minutes, along with the value from the same period 52 weeks earlier for comparison.
{
  "metrics":[
    "Sales_Amount",
    "Sales_Amount__sameperiod__-52_wow__growth"
  ],
  "dimensions": [
    "metric_time__30minute" // Note 1
    ],
  "timeConstraint": "[metric_time__minute]>=dateTrunc(now(),\"DAY\") and [metric_time__minute]<=dateTrunc(now(),\"minute\")", // Note 2
  }
}
-
Note 1: metric_time__30minute
- Use the __30minute method to quickly switch the query granularity to 30 minutes.
-
Note 2: [metric_time__minute]>=dateTrunc(now(),\"DAY\") and [metric_time__minute]<=dateTrunc(now(),\"minute\")
- Queries data where the date is today and the time is earlier than or equal to the current time.
!!! note "Note: If you filter only by TODAY( ), the system will calculate 52-weeks-earlier comparison values for future times today.
For example, if the current time is 12:00 and you do not limit the query to times earlier than or equal to the current time, the result will include comparison values for future times such as 12:30 and 13:00 from last year, which contaminates the data." If you filter only by TODAY( ), the system will calculate 52-weeks-earlier comparison values for future times today.
For example, if the current time is 12:00 and you do not limit the query to times earlier than or equal to the current time, the result will include comparison values for future times such as 12:30 and 13:00 from last year, which contaminates the data.
Today's Cumulative Sales Amount Trend
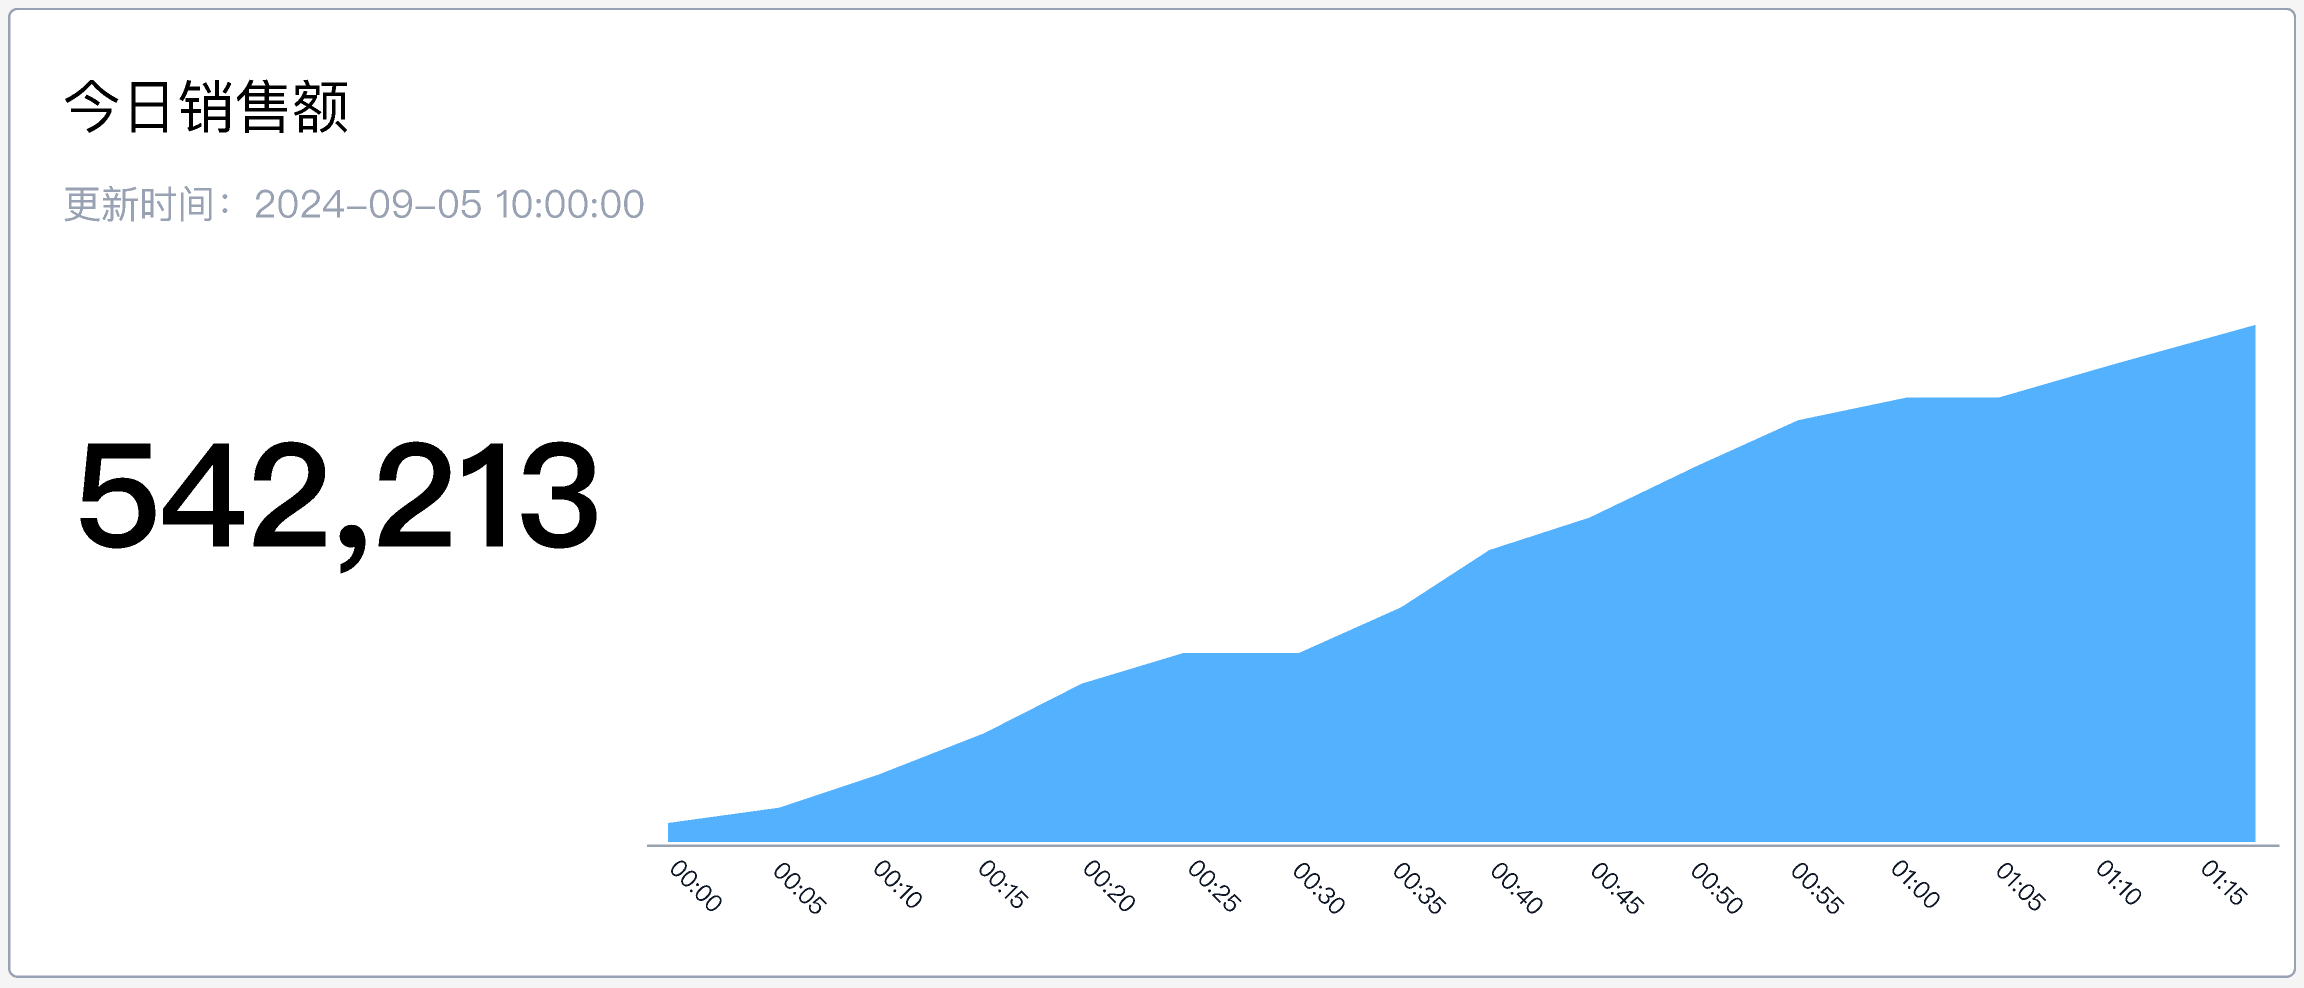
Use an area chart to show today's cumulative sales amount, with one data point every 5 minutes to show cumulative changes.
{
  "metrics":[
     "Sales_Amount__period__dt10min", // Note 1
  ],
  "dimensions": [
    "metric_time__10minute" // Note 2
    ],
  "timeConstraint": "[metric_time__minute]>=dateTrunc(now(),\"DAY\") and [metric_time__minute]<=dateTrunc(now(),\"minute\")",
  }
}
-
Note 1: Sales_Amount__period__dt10min
- Use __period__dt10min to quickly calculate the metric's cumulative value from the start of today to the current 10-minute interval.
-
Note 2: metric_time__10minute
- Returns multiple rows for today, using 10 minutes as the interval for each data point.
Method Summary
Single-Metric Query
Use the metric directly with a time range filter to aggregate and return the value.
Metric Interval Summary
When querying metric distribution, use date as the dimension and switch the date granularity by using the dimension + granularity shortcut.
!!! note "metric_time_[ year | quarter | month | week | day | {N}hour | {N}minute ]
Hours and minutes support custom statistical step sizes. For example, 3hour means intervals are divided every 3 hours starting from hour 0. Hour 02 is grouped into the 00 hour interval." metric_time_[ year | quarter | month | week | day | {N}hour | {N}minute ]
Hours and minutes support custom statistical step sizes. For example, 3hour means intervals are divided every 3 hours starting from hour 0. Hour 02 is grouped into the 00 hour interval.
Metric Cumulative Trend
When querying a metric's cumulative trend, add a temporary time limit to the metric, then use the dimension + granularity shortcut to return multiple rows of data.
!!! note "The system provides three built-in methods for adding time limits to metrics:
| Type | Syntax |
|---|---|
| Last N days | 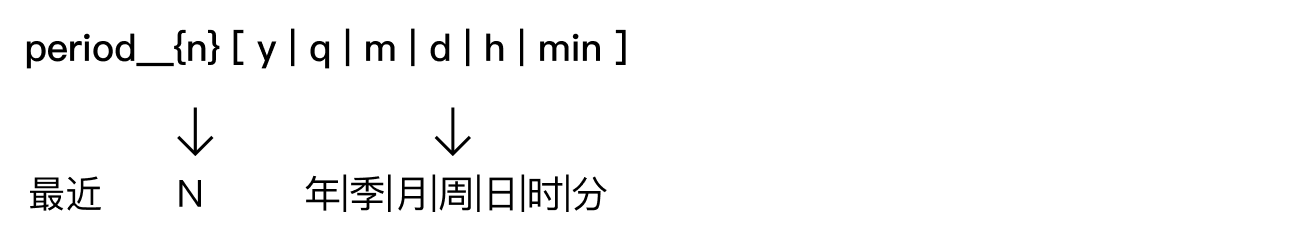 Last 7 days: ordercounts__period__7d Last 7 days: ordercounts__period__7d |
| To date | 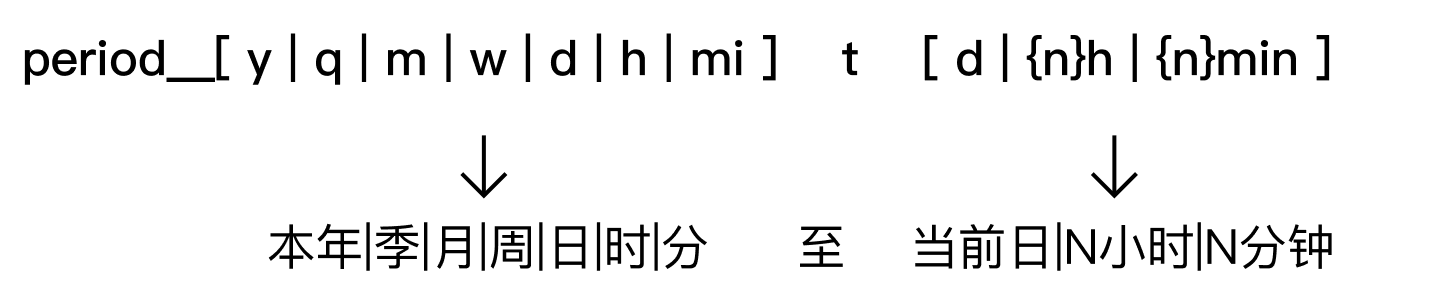 Year to date (day): ordercounts__period__ytd Day to date (5min): ordercounts__period__dt5min Year to date (day): ordercounts__period__ytd Day to date (5min): ordercounts__period__dt5min |
| Current |  Current year: ordercounts__period__cy Current 5min: ordercounts__period__c5min Current year: ordercounts__period__cy Current 5min: ordercounts__period__c5min |
| The system provides three built-in methods for adding time limits to metrics: |
| Type | Syntax |
|---|---|
| Last N days | Last 7 days: ordercounts__period__7d |
| To date | Year to date (day): ordercounts__period__ytd Day to date (5min): ordercounts__period__dt5min |
| Current | Current year: ordercounts__period__cy Current 5min: ordercounts__period__c5min |
| ## Usage Constraints |
-
Due to query performance limits, metrics currently do not support analysis or viewing at second-level granularity. The minimum granularity is
minute, which means the minimum supported value ismetric_time__minute. -
After adding a shortcut time limit to a metric, make sure the query dimension matches the granularity of that time limit.
- For example,
ordercounts__period__dt5min(from the start of today to the current 5-minute interval) has 5-minute time granularity, so usemetric_time__5minuteas the analysis dimension when querying.
- For example,
-
Pay attention to the granularity of metric_time used in the query.